The information in this article is the intellectual property of xMatters and is intended only for use with xMatters products by xMatters customers and their employees. Further, this intellectual property is proprietary and must not be reused or resold.
This release celebrates Out Run, one of the most influential racing video games of all time. With its stunning scenery, tunes so popular they inspired a sub-genre of electronic music, and realistic-feeling ride behind the wheel of a Ferrari Testarossa Spider, Out Run fulfilled designer Yu Suzuki's ambition of a game "you could drive one-handed listening to the car stereo while leaving the competition in the dust".
While we'd like to think our Out Run release provides similar gameplay for managing your digital services, we'll let you be the judge once you take the features and usability enhancements we've packed into this release out for a spin. We've got new service-centric automations that make incident management easier for resolvers, improved service visibility from our mobile platform, the ability to get notified in chat apps, a new interface for creating and managing broadcast groups, plus lots, lots more.
Before you dive in to learn about all the improvements, here are some important dates:
- Non-production environment access: Tuesday, February 15
- Production environment access: Tuesday, March 1 (enabled between 10:00-10:30am Pacific)
Out Run Training Webinars
For a guided Out Run tour — including tips and tricks — sign up for one of our webinars.
Future feature release
As a special bonus, we'll also give you a sneak peek at enhancements we're working on for a future release:
- Slack as a device — receive and respond to incident alerts, updates, & other notifications as DM's in your chat.
- Broadcast groups — create a list of users to notify at the same time.
- Include direct notifications in temporary absences — explicitly control if your replacement should receive notifications that target you directly (not as part of a group).
Our Community shrinks images for convenience but allows you to click on them for a closer look. See an image or animated GIF you like? Click it.
Jump ahead
In a hurry? Here's an overview of this doc if you want to skip ahead to something awesome:
- Incident Response & Service Intelligence
- Automation
- User Experience
- Reporting
- Other Product Updates
- Mobile App Updates
Incident response & service intelligence
Our adaptive incident management capabilities help you bridge your tools and teams, facilitate collaboration, and automate manual processes with ease — while also providing data to inform and continuously evolve your incident resolution processes. In this release, we add new service intelligence capabilities, the ability to get notifications in chat apps (starting with Microsoft Teams), and additional ways to monitor the efficiency of your response.
Service intelligence
The xMatters service reliability platform embeds services directly into its incident management capabilities to supercharge your response to digital service interruptions. This release, take advantage of the ability to run service-centric automations during an incident from the Incident Console or service dependencies map, and gain situational awareness of the services involved in an incident when you're on the go with the xMatters mobile app.
Run incident & service-centric automations
Earlier this month we released automations, a solution for making incident management easier for commanders and resolvers by reducing the time to diagnose, mitigate, and resolve incidents.
By using a new Incident Automation trigger in Flow Designer, you can build automated tasks that incident resolvers can run directly from the Incident Console. For example, with the click of a button resolvers can do things like update a status page, run a health check, or initiate a rollback — the possibilities are nearly endless, especially when you use automations to run custom scripts in your environment.
Service-centric automations
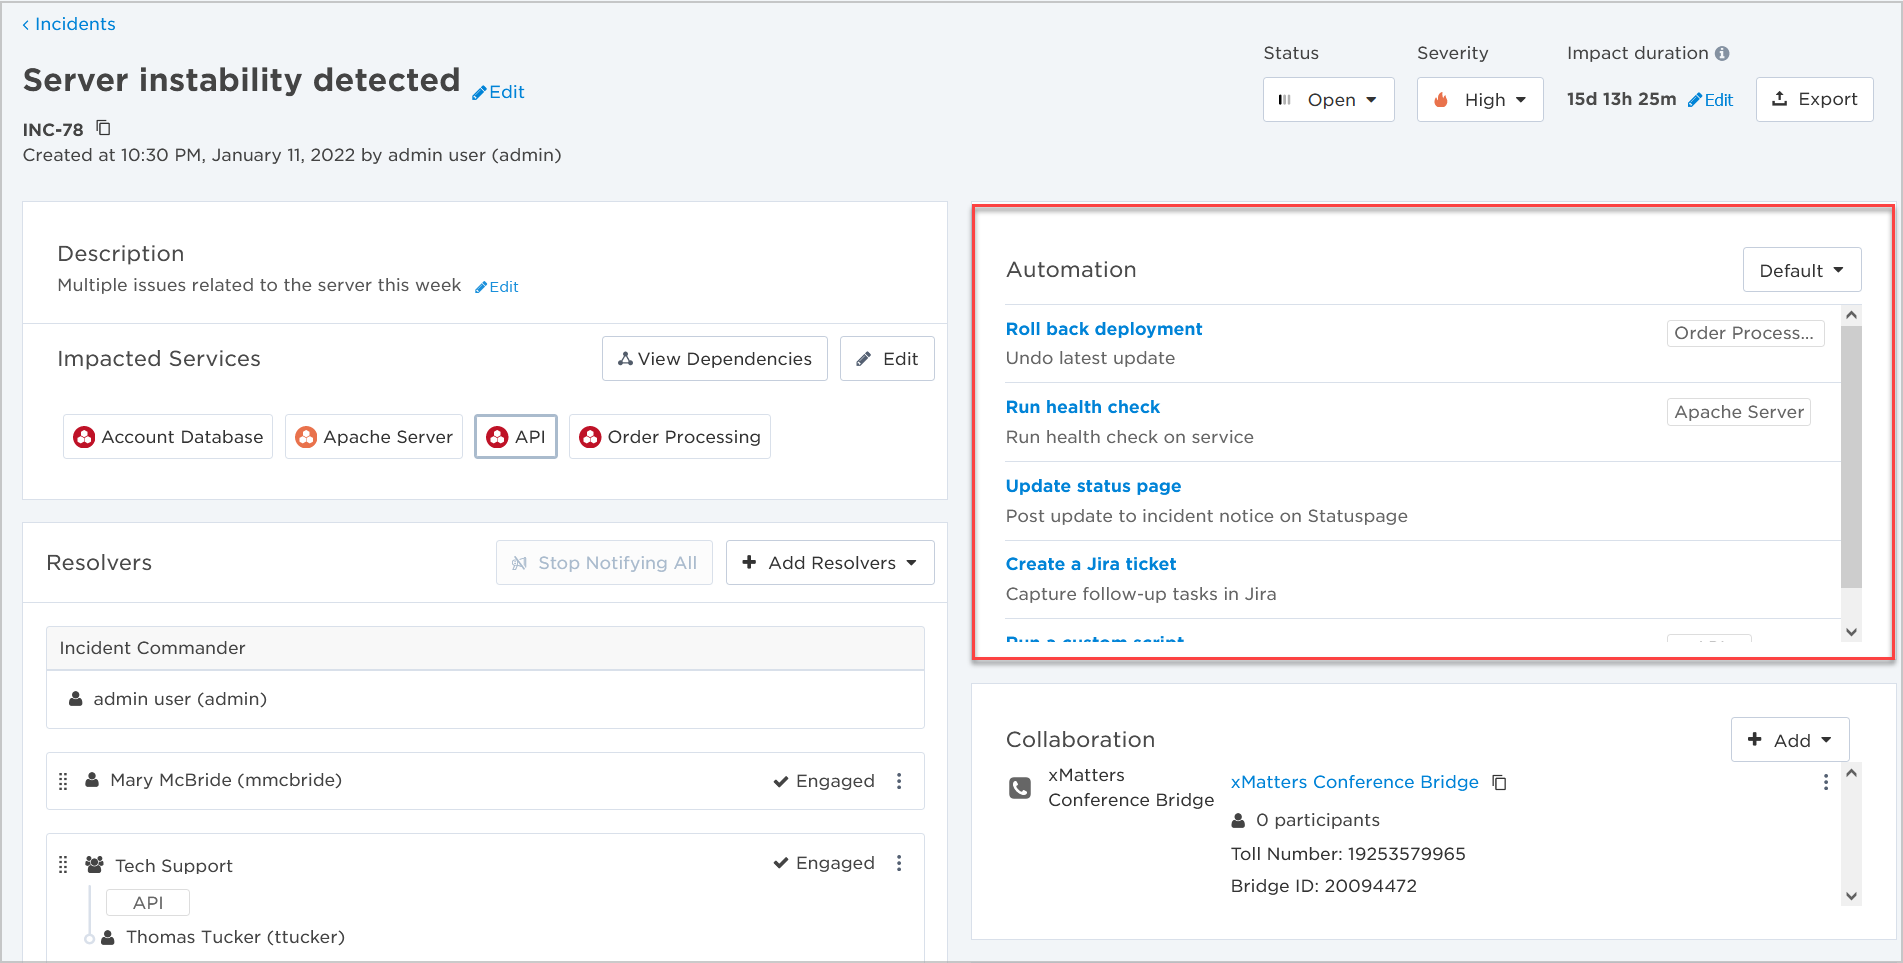
When you configure an incident automation trigger, you have the option to associate the automation with a specific service (and limit its use to members and supervisors of the group that owns that service). This helps resolvers prioritize the automation when that service is impacted, as well as access the automation when interacting with the service in the Impacted Services section of the console or service dependencies map during an incident.

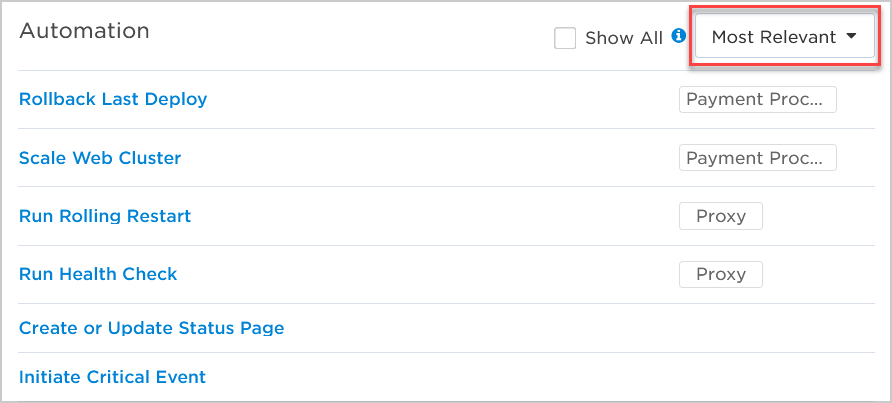
During an incident, resolvers can sort automations in the Incident Console by 'Most Relevant' to prioritize which automations they should run to resolve issues with the specific services impacted by the incident:
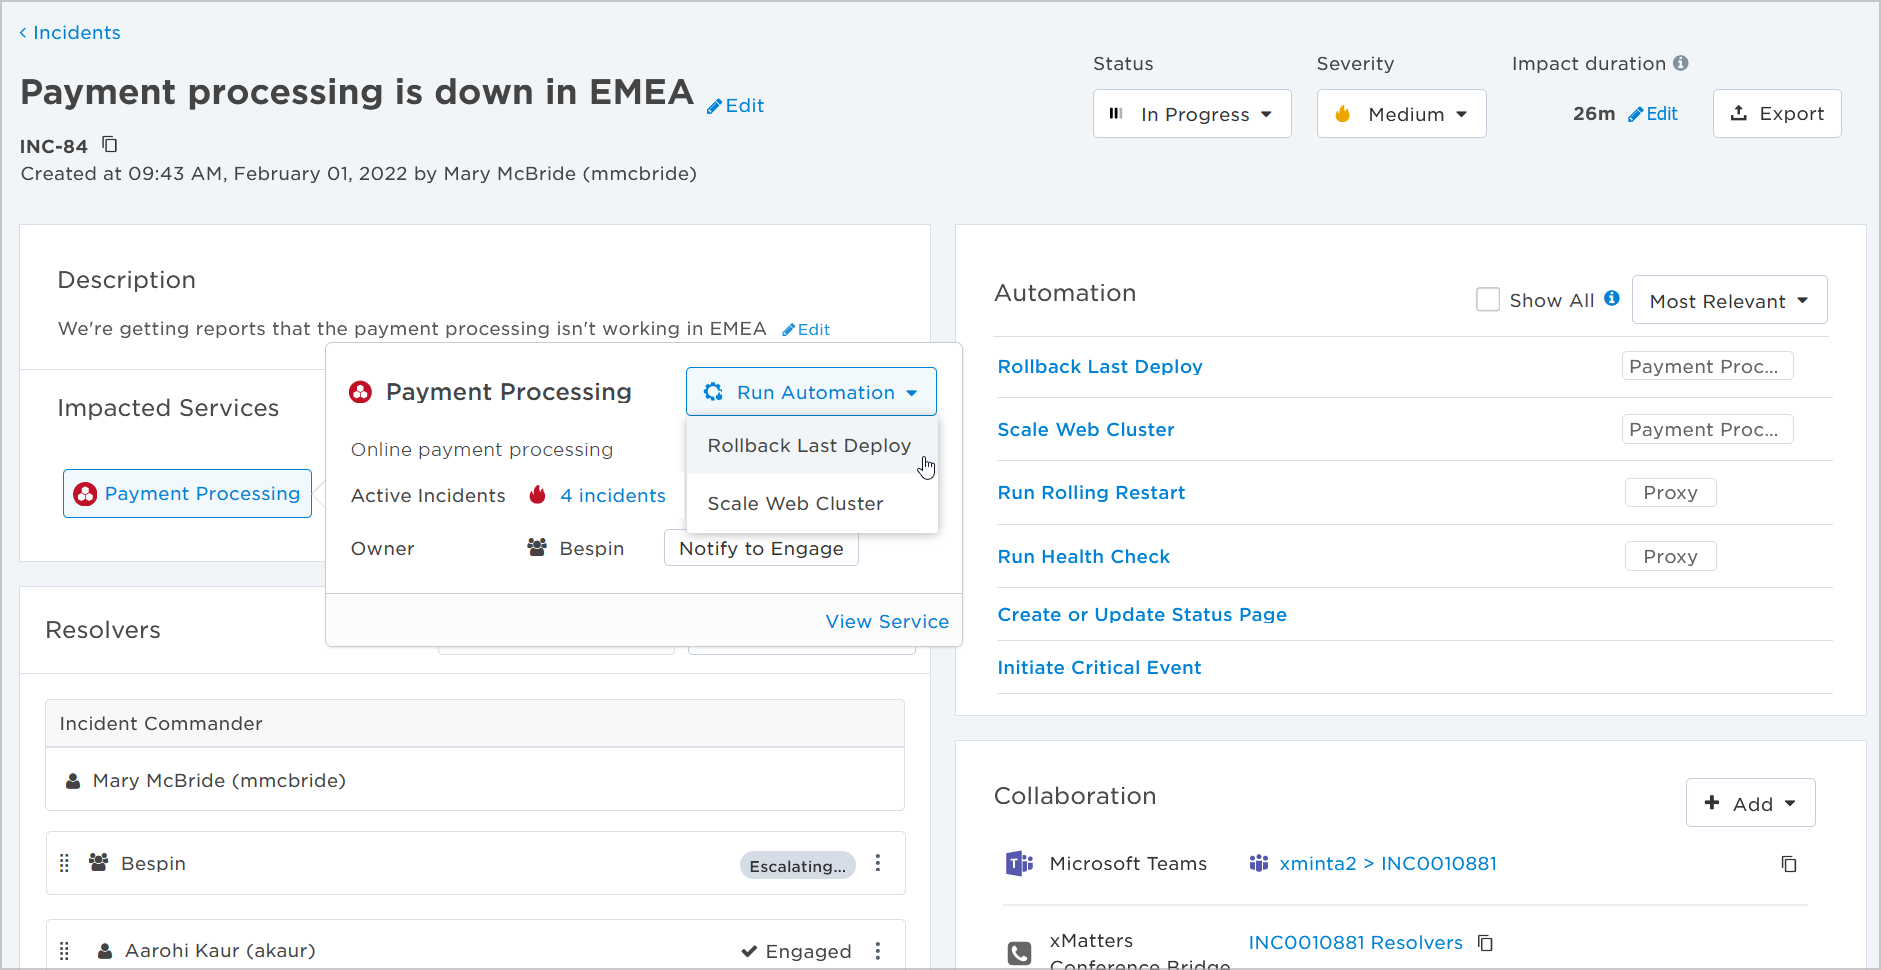
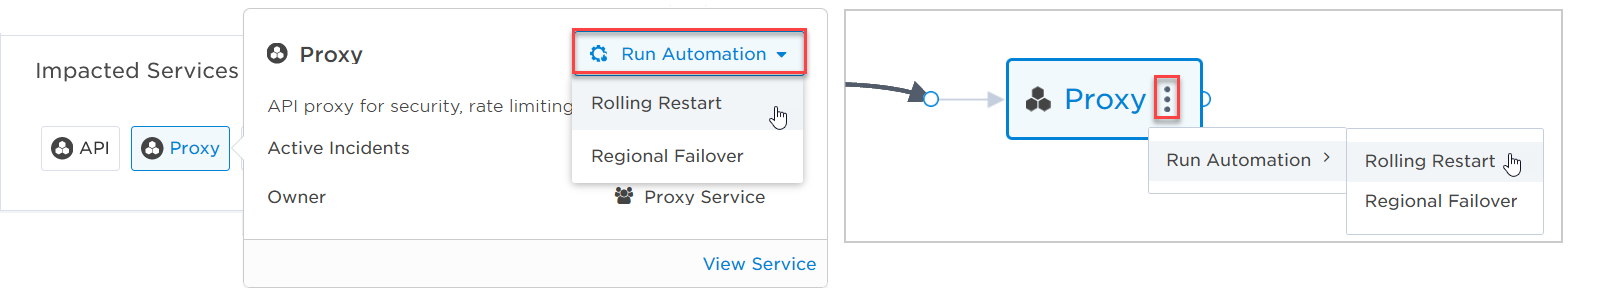
You can also run service-specific automations from a service's info card in the Impacted Services section of the Incident Console, or directly from an incident's service dependencies map while you're exploring the incident's potential root cause:
For more information about automations, see our announcement article Introducing Automations.
View and engage services from the mobile app
Supporting service intelligence throughout our product also applies to our mobile apps. We've recently equipped our iOS and Android apps to display impacted services for incidents and to allow you to engage their owners, as well as the ability to search by service name when adding resolvers or recipients.
View impacted services & notify their owners to engage
The Overview screen for an incident now includes the Impacted Services section, where you can view which services are reported as affected by the incident. You can tap a service to view more details about it, such as its description, owner, whether it's reported in any other active incidents, and to 'notify to engage' the group that owns it:

Add services as recipients & resolvers
You don't need to know which group owns a service to include it as a recipient on messages or as a resolver of incidents. Simply search for the name of the service in the recipients or resolvers list and your results will identify which group you need to contact:

Hide services on the service dependencies map
By design, our service dependencies map displays a focused view of direct dependencies. While you can expand the map to view additional upstream and downstream services, what if you want to collapse the map to focus on specific services?
To do this, we've added new granular controls to each service so you can hide its upstream or downstream services. Simply hover over a service to access these controls (they appear as circles that contain the minus ("-") symbol). You can hover over a control to preview which parts of the map — shown as dashed lines — will be hidden when you click:
Incident Response
Effective response and collaboration are key to timely incident resolution. To support customers that spend a lot of time working in popular chat apps, we've added Microsoft Teams as a device type in xMatters. (Don't worry, Slackers — your app is up next!) There's also a new widget for monitoring MTTA and MTTR, updated resolver statuses for groups, and the ability to view incident stakeholders from the mobile app.
Use chat apps as devices (Microsoft Teams)
Availability: Coming soon
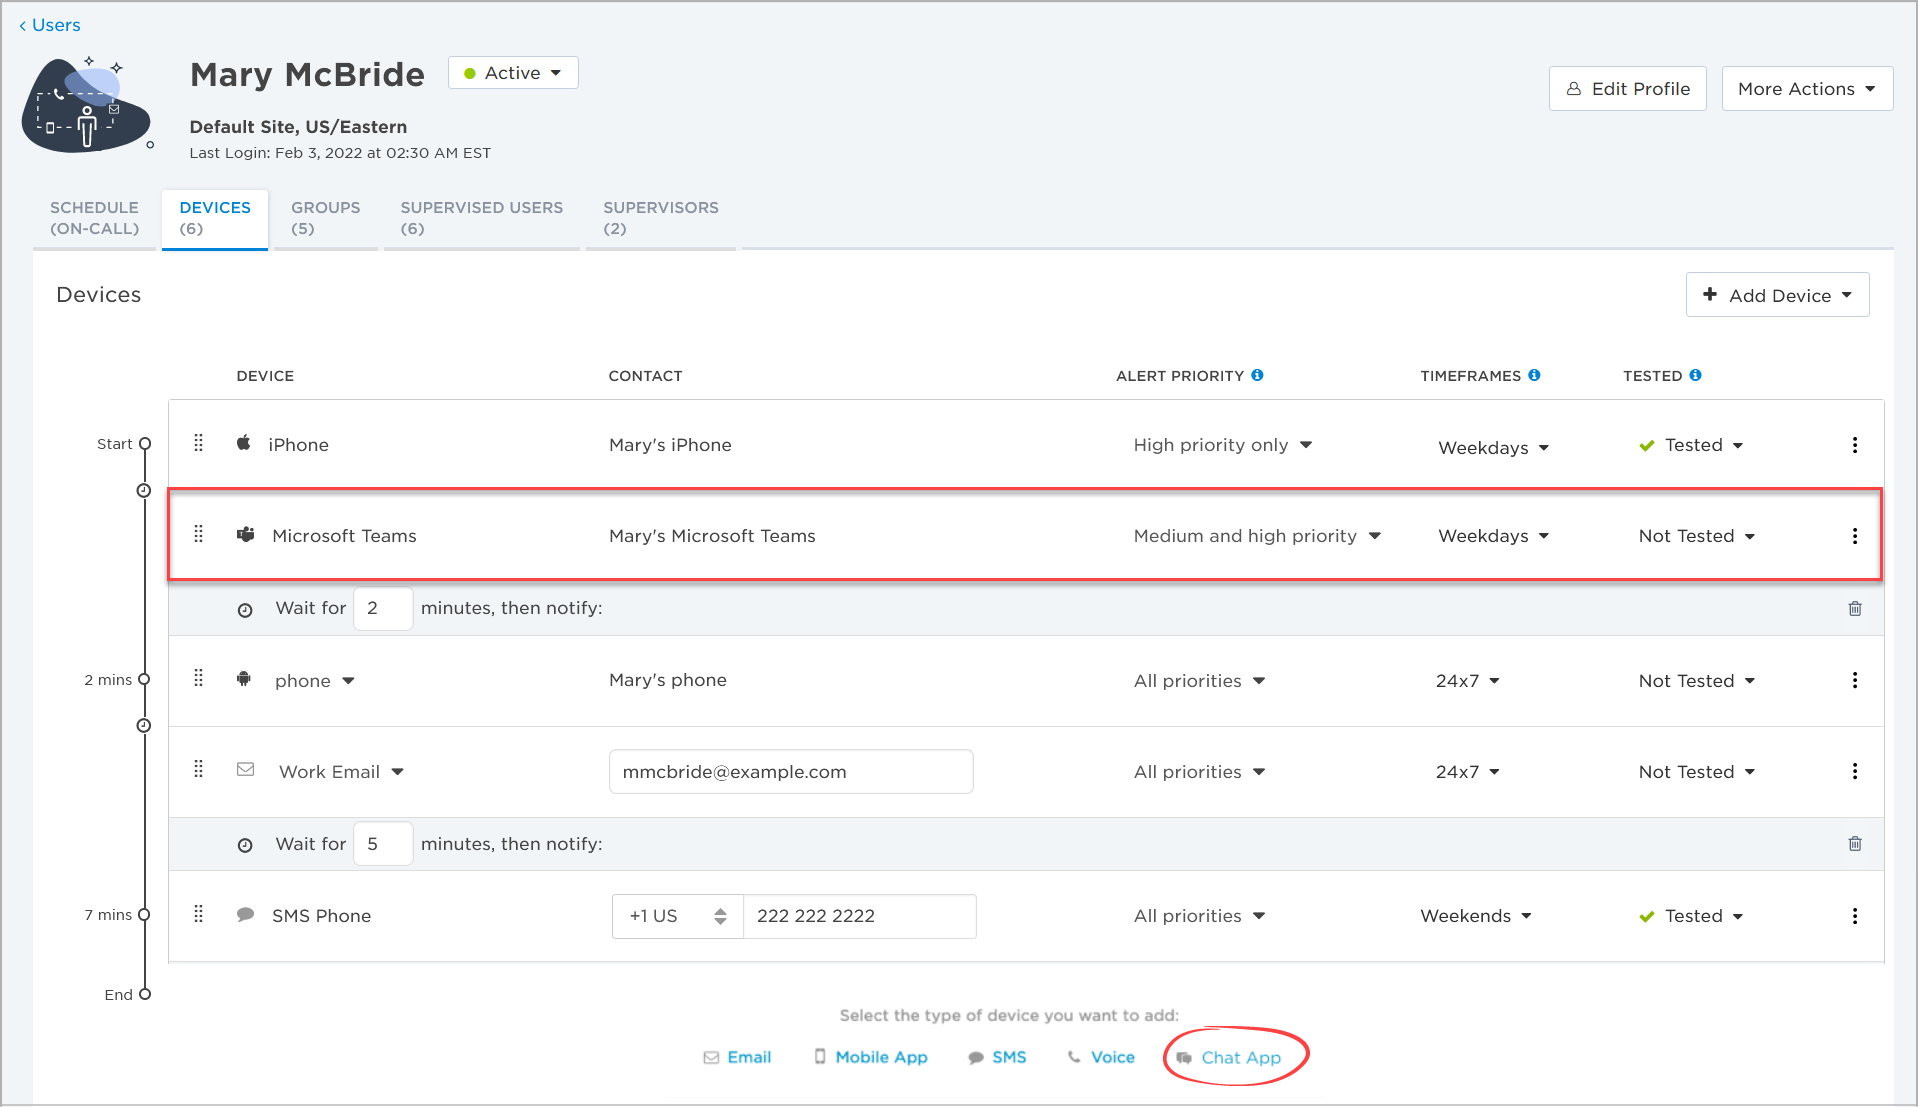
xMatters lets you receive notifications on your preferred devices, including Email, Voice, Mobile App, and SMS — and now we've added 'Chat App' to that list! This new type of device will allow you to receive notifications as direct messages in your preferred chat applications, starting with Microsoft Teams:
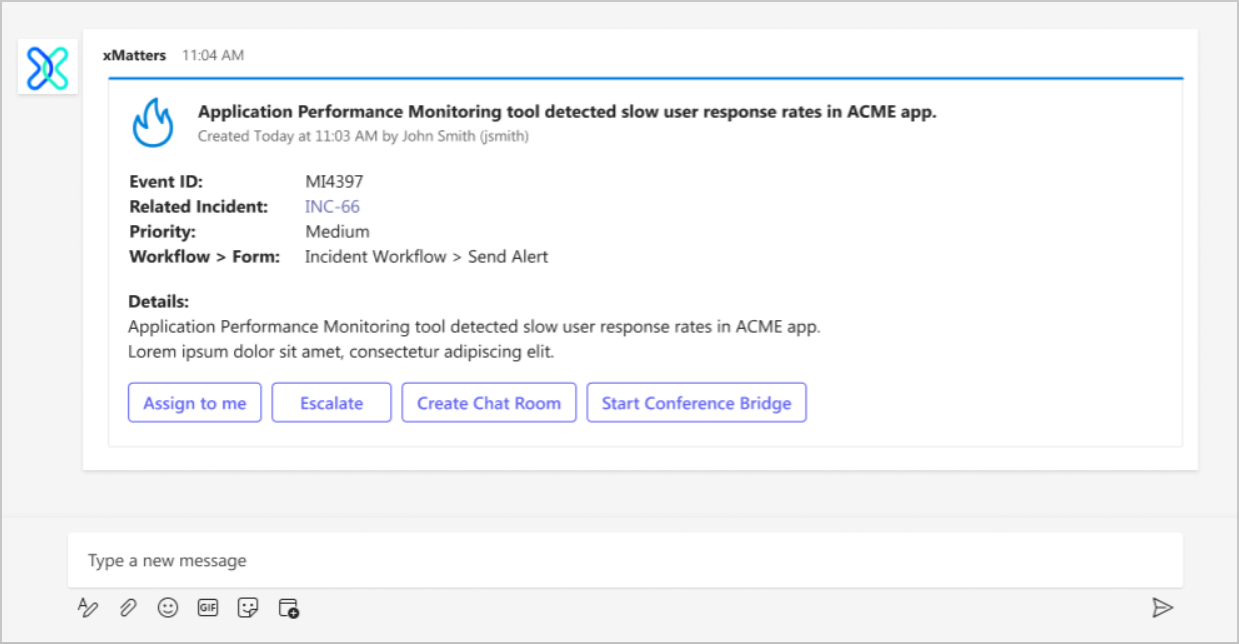
Many organizations use Microsoft Teams as their internal communication and collaboration app. By adding Microsoft Teams as a device, users won't need to disrupt their workflow to check an email or open xMatters to collaborate. They'll be able to receive xMatters notifications, view incident details, and respond to alerts directly within their Teams chat:
This new feature is in addition to the existing ways we already integrate Microsoft Teams into your incident response, including: a bot to help you in Teams, a Meeting plug-in to view and update incidents inside of a meeting, and Flow Designer steps to create channels and post into them.
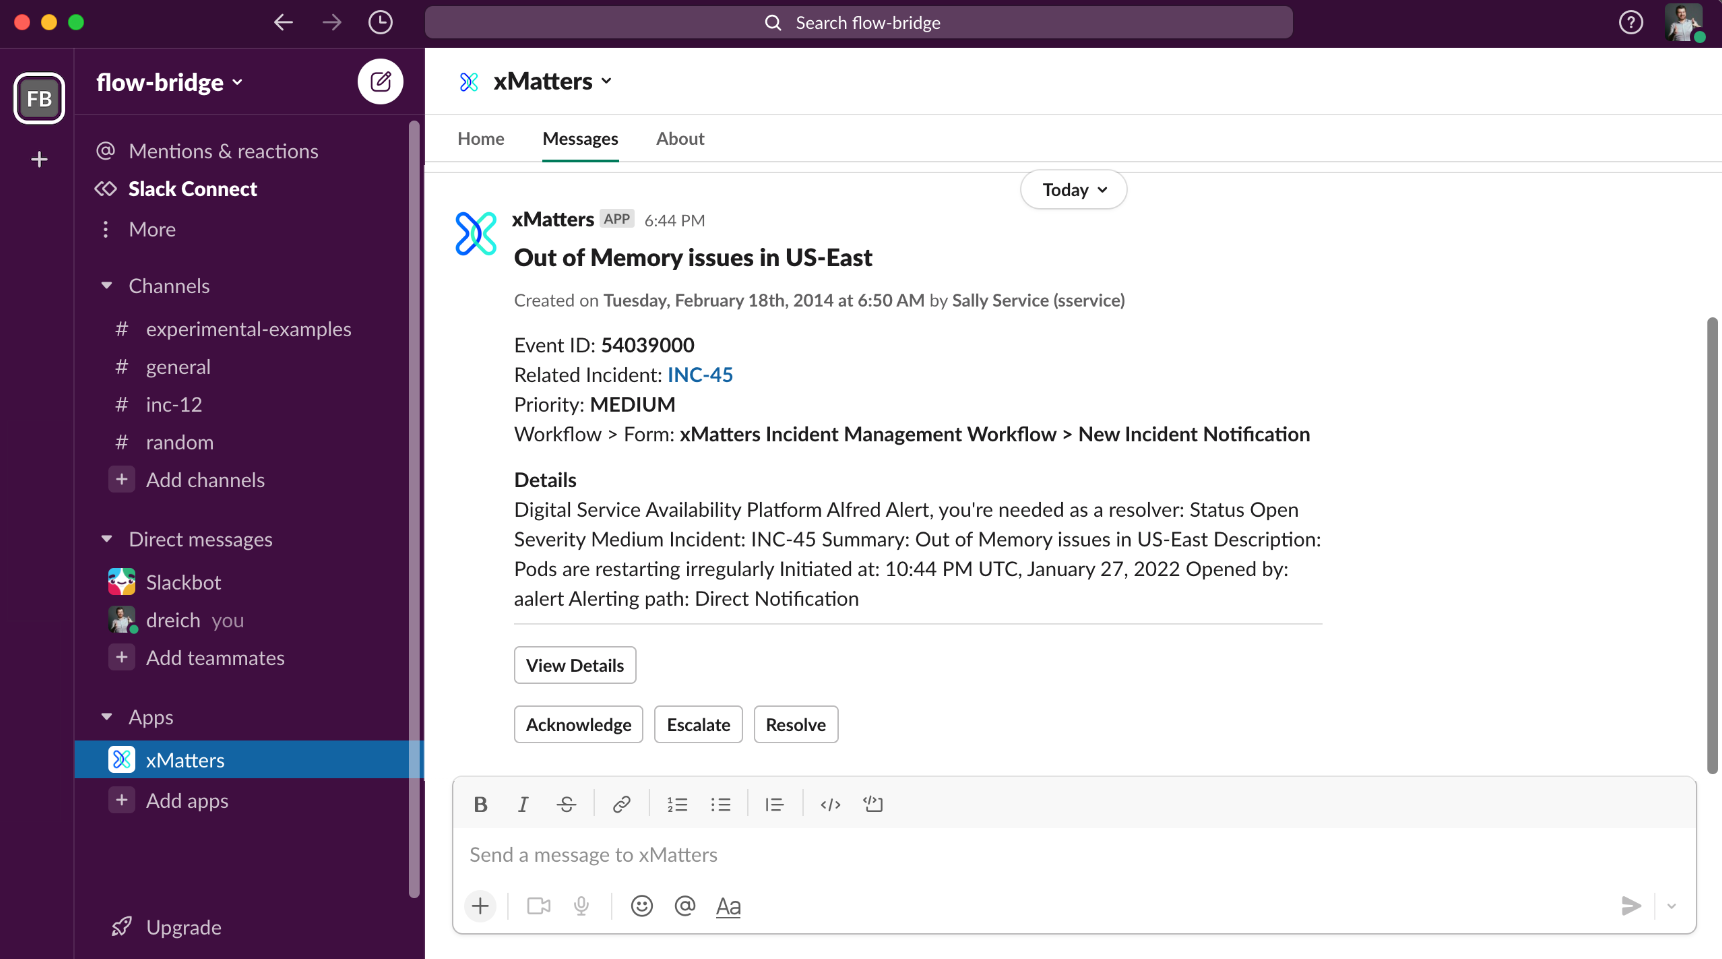
Sneak peek: Slack as a device
Slack is the next chat app we'll be adding as a device type in xMatters. Slackers will soon be able to receive their notifications, view incident details, and respond to alerts right in their chat channels. Here's a peek at what that might look like:
Monitor incident MTTA & MTTR
The Incident Activity widget includes a new 'Incident MTTA & MTTR' graph. By adding one or more of these graphs to your dashboards, you can monitor trends for 'Mean Time-To-Acknowledge' and 'Mean Time-To-Resolve' metrics for incidents of different severity levels, over different timeframes (e.g., past 24 hours, past 90 days, and at specific points in time).
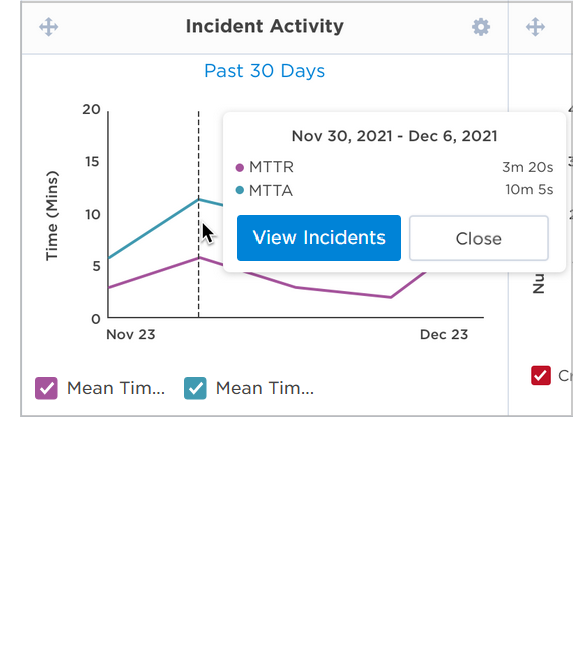
You also have the option to drill-through to the Incidents list to explore a graph's underlying data in more detail. We've added new 'Time to Resolve (mins)' and 'Time to Acknowledge (mins)' columns to the Incidents list so you can see these metrics for individual incidents or use them to report on specific subsets of incidents.
See group escalation status in resolvers list
Previously when you'd notify a group to engage in an incident it could look like no one had responded, when in reality the notification was escalating to secondary on-call responders. To provide incident commanders better clarity on the engagement status of groups they've notified — and to prevent them from unnecessarily renotifying groups to engage — we've added a new 'Escalating' status to the Resolvers section of the Incident Console:
We'll display this status once the notification escalates to the secondary on-call resource, and we'll continue to display it until someone responds, or for five minutes after the last user in the escalation path gets notified. After this we'll mark the group as 'No Response' and you won't have to worry about spamming the group if you renotify them to engage.
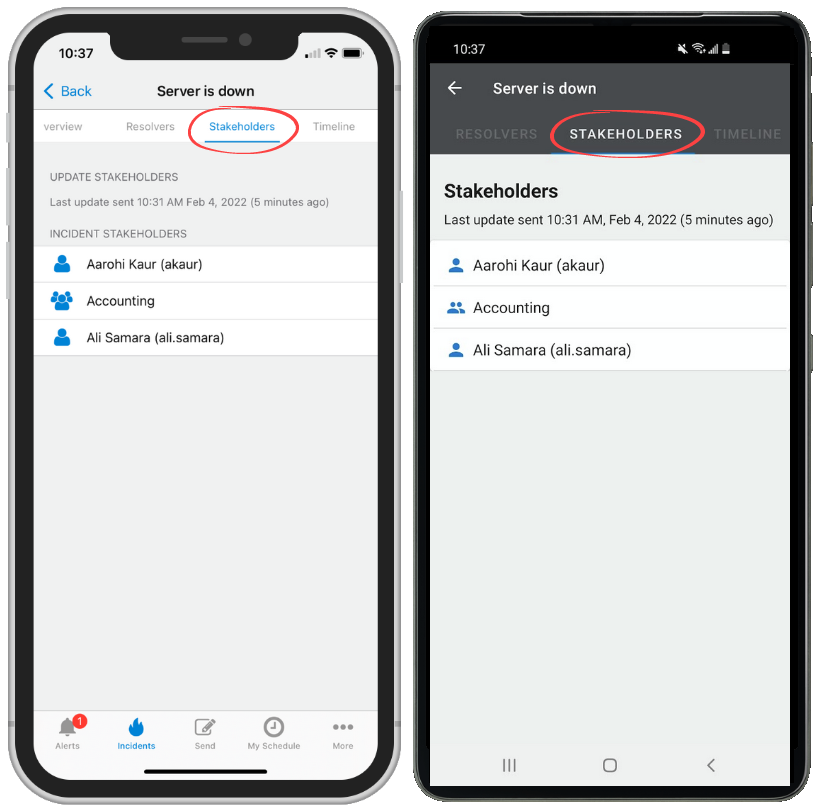
View incident stakeholders from the mobile app
Incidents in our mobile apps now include a 'Stakeholders' tab, where you can track who is receiving updates about the incident (other than active incident resolvers, of course):
Automation
In addition to an exciting new way to surface incident and service-related automations for incident commanders and resolvers, we've added a lot of new functionality and usability improvements to Flow Designer, plus several new and updated endpoints to the xMatters REST API.
Flow Designer
Flow Designer is the user interface for our integration platform. It provides an all-inclusive visual canvas that allows users of any technical ability across the enterprise to integrate and create incident resolution workflows with ease.
Call a flow to run
Availability: Coming soon
We've created a new type of 'Callable Flow' step that you can add to your flows to call a sequence of steps. This means you'll be able to reuse the same sequence of steps in multiple flows in your workflow, making your flows simpler to maintain, and more readable.
For example, if you need the option to initiate a major incident process in more than one of your flows, instead of including the same sequence of steps in each flow (such as posting to a status page, creating or updating chat channels, opening a help desk ticket, sending notifications, etc.), you could build the sequence once — as a separate, reusable flow — and then include a step in your other flows to call that flow to run. What's really convenient is that if you ever need to change the steps in your process or modify their configuration, you only need to do it in one place.
Here's how it works
A callable flow step works in tandem with a 'Callable Trigger'. You use the callable trigger to build the sequence of steps you want to run and to define the information needed as inputs from the flow that's going to call it.
Next, you can add the callable flow step associated with your trigger in any of your flows — they don't even need to be on the same canvas (but they'll need to be in the same workflow). When that step runs as part of your flow, it'll call your trigger to run the sequence of steps.
New & updated workflows
This release we added seven new low-code workflows and added an option to our ServiceNow integration to check the instance URL before attempting a data sync.
Low-code workflows (& triggers, too)
Our mission to simplify the process for getting integrated with xMatters continues this release, with the addition of new low-code workflows. Instead of having to download and import a .zip file, you can install these workflows directly from within xMatters — just select the workflow from the list of available templates and click 'Install':
These workflows include new App triggers to accept the incoming signal, which are connected to a pre-built flow that creates an alert when xMatters receives a signal from the external system. When on-call resources respond to the notification, they have the option to initiate an incident. You then have the option to use Flow Designer's powerful visual interface to further customize or enhance the workflow's functionality to meet your organization's specific needs.
This release, we've added the following low-code workflows:
 |
Cherwell Automatically notify on-call resources when new incidents are created. Responders can update assignments, escalate to key personnel, and add annotations to the incident from any mobile device. |
 |
pgDash Trigger remediation workflows and context-rich alerts from pdDash incident data. |
 |
SolarWinds AppOptics |
 |
SolarWinds Loggly Relay key insights to on-call responders when xMatters receives a signal from Loggly, helping your team solve key application and infrastructure issues. |
 |
SolarWinds Network Performance Monitor Relay critical insights to the right people when xMatters receives a signal from SolarWinds Network Performance Monitor, letting your team resolve issues before they impact your customers. |
 |
SolarWinds Papertrail Send alerts with key insight data when Papertrail sends a signal that something is wrong, letting your team troubleshoot infrastructure and application issues faster. |
 |
Sysdig Combine xMatters with Sysdig Monitor to trigger alerts and deliver key information to the right on-call resource on their preferred device. Acknowledge alerts and capture audit details right in Sysdig. |
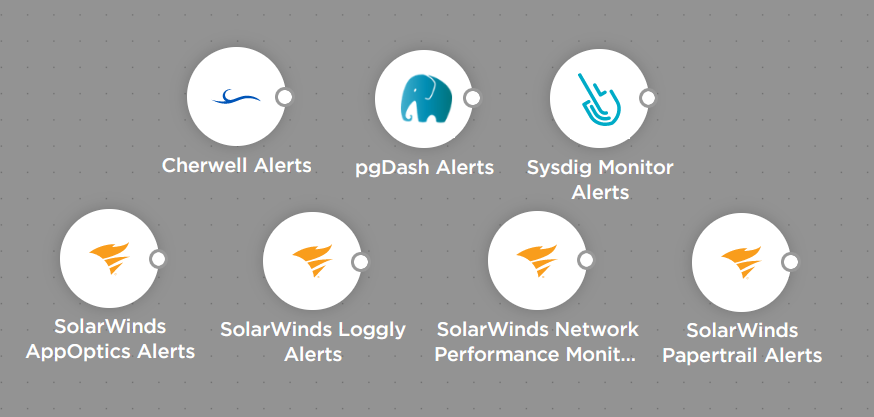
New App triggers
Our workflows are built using triggers and steps and we also release these for you to use in your workflows. That means you can take advantage of the following new App triggers to build your own custom signal handlers in xMatters:
- Cherwell Alerts
- pgDash Alerts
- SolarWinds AppOptics Alerts
- SolarWinds Loggly Alerts
- SolarWinds Network Performance Monitor Alerts
- SolarWinds Papertrail Alerts
- Sysdig Monitor Alerts
ServiceNow: Check instance URL before data sync
We've added a new option to our ServiceNow integration to 'Check Instance URL'. When selected, the data sync to xMatters will only be attempted if the ServiceNow Instance URL matches the value specified in the integration's Data Sync settings. This enhancement should help prevent inadvertent data syncs and loss of data when you're cloning ServiceNow instances.
New & updated steps
In addition to the new app triggers we discussed above, this release includes several other new and updated steps to automate processes, reduce toil, and bring actionable context to your DevOps and service management teams.
Acknowledge or close incidents in New Relic
We've added a New Relic 'Acknowledge or Close Incident' step to Flow Designer. Include this step in your flows to automatically acknowledge or close New Relic incidents as part of your workflow process:

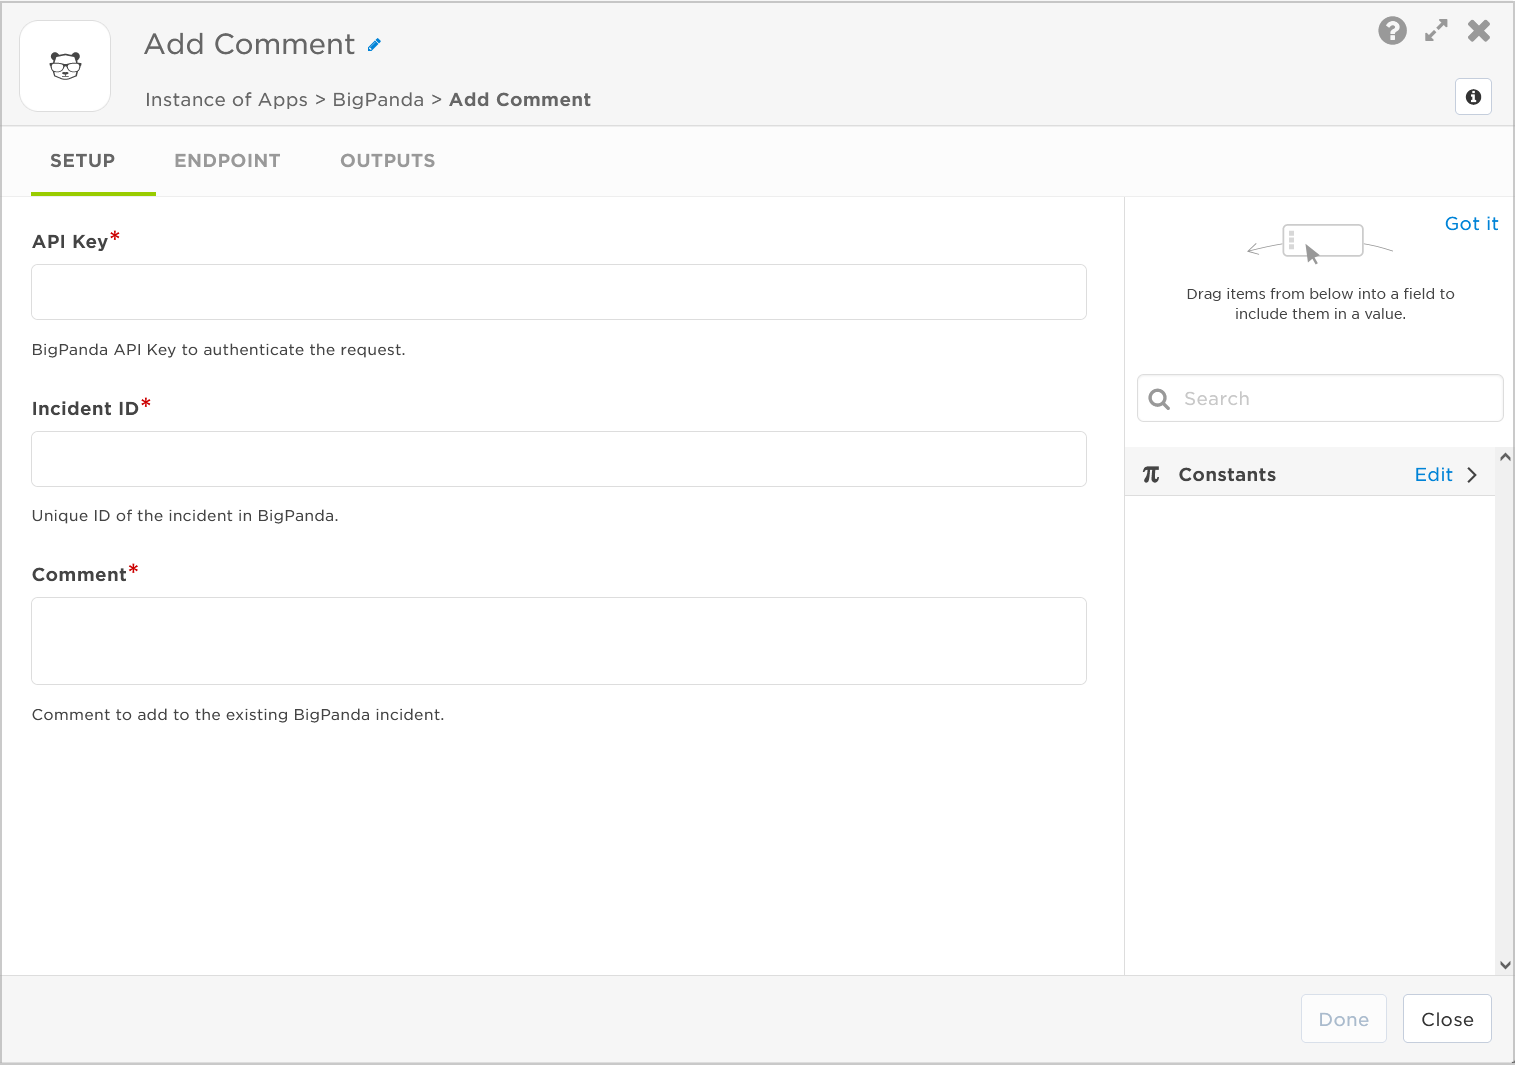
Add a comment in BigPanda
We've also added a BigPanda 'Add Comment' step that you can use to automatically add comments to your incidents in BigPanda as part of your flows:
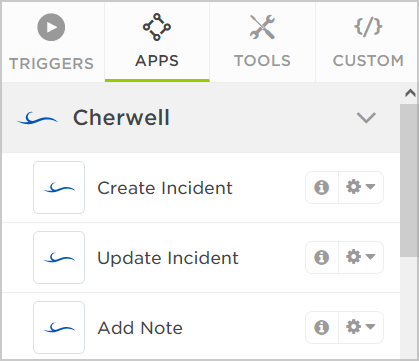
Create & update incidents, and add notes in Cherwell
You can use the following steps in your flows to automatically create and update incidents in Cherwell, and add notes to them:
- Create Incident - Create an incident in Cherwell.
- Update Incident - Update an incident in Cherwell.
- Add Note - Add a note to the Journal for an existing Cherwell incident.
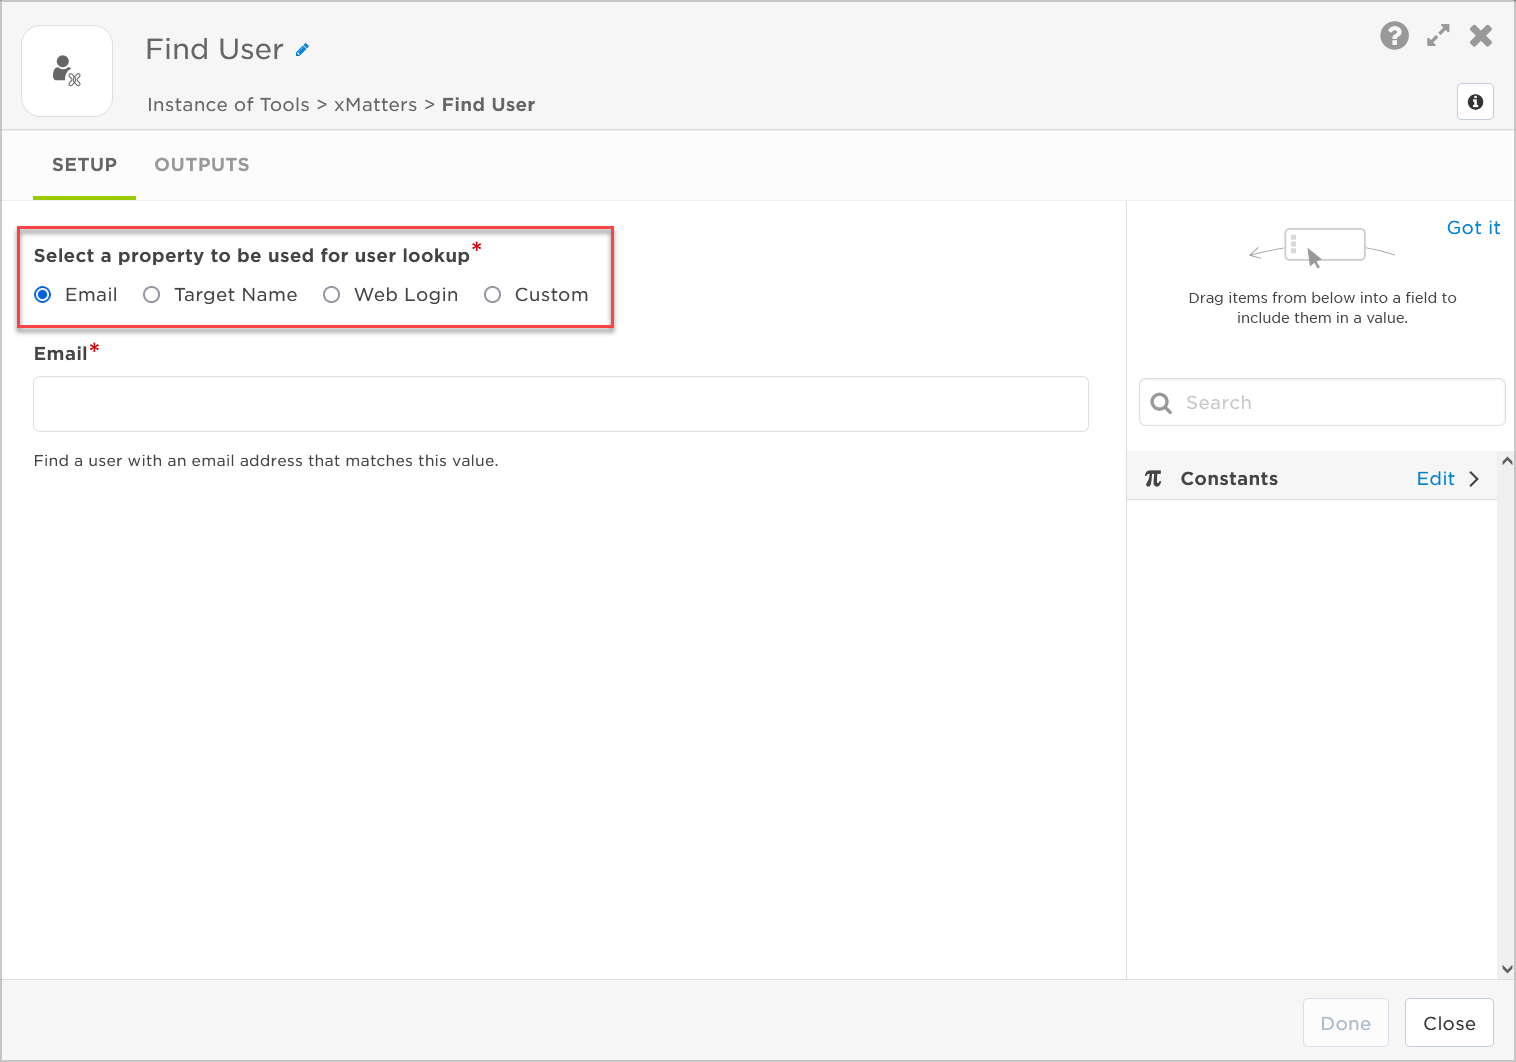
Look up users by standard properties
We've enhanced our Find User step to allow you to look up users by more than just the value of a custom user property — you can now also find users based on their email address, target name, or web login:
Usability improvements
A key goal of Flow Designer is to make it simple for anyone to set up an integrated toolchain. This means usability is the central theme for every new feature or enhancement we add — but also for making the things we already have in place even better. Here are a few of the usability improvements we've added to existing Flow Designer features.
Activity panel updates
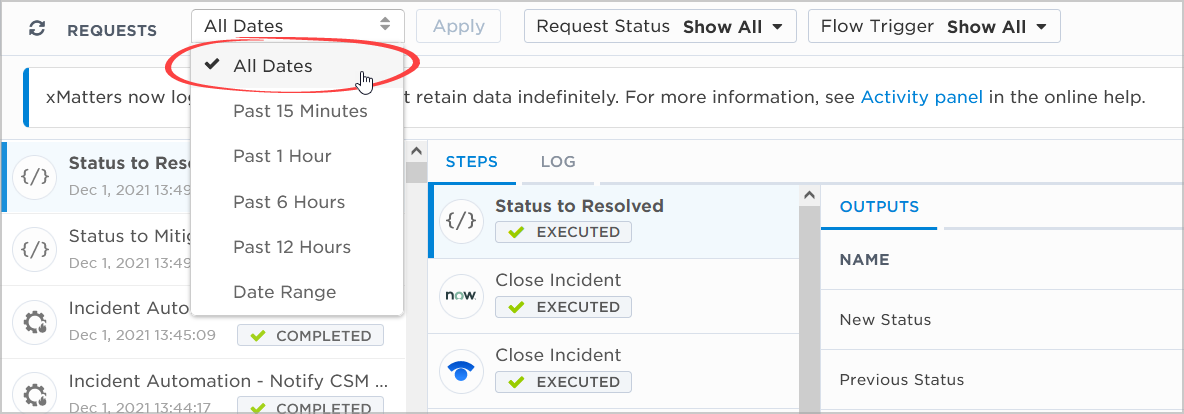
To make it even easier to monitor and troubleshoot your flows, we've added several great new enhancements to Flow Designer's Activity panel:
- View all dates: We've added a new 'All Dates' option to the timeframe selector and made it the default setting. This means you won't have to fiddle with the date and time pickers when you want to see flow activity from more than 12 hours ago.
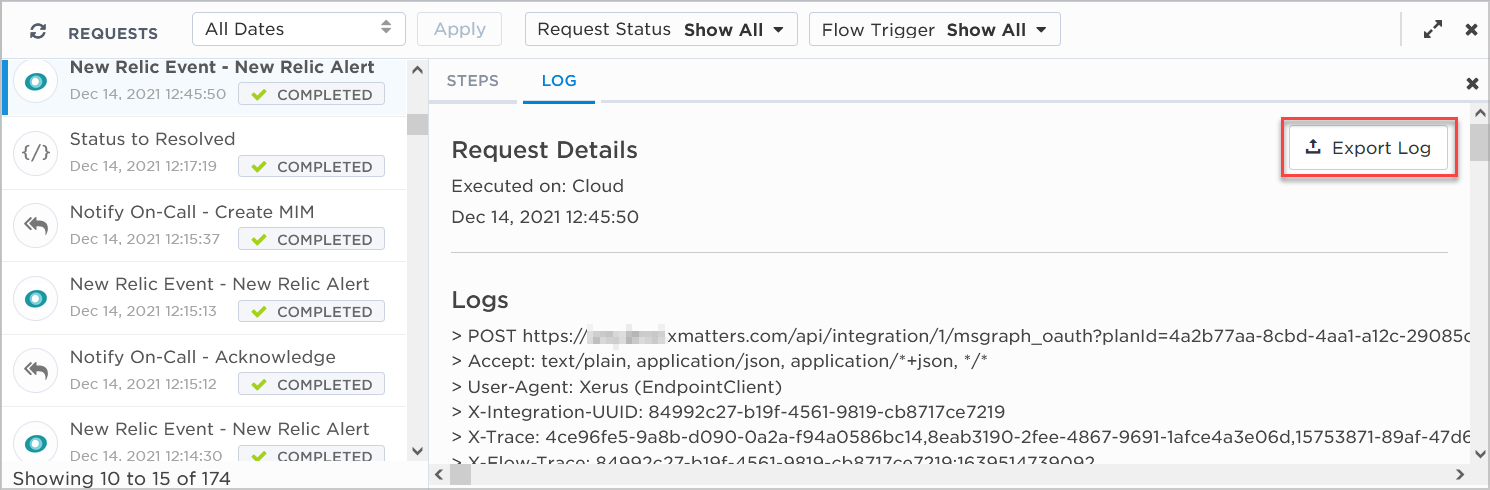
- Exportable logs: You can now export an Activity log to a .txt file to share it with others or view it in your preferred text editor.
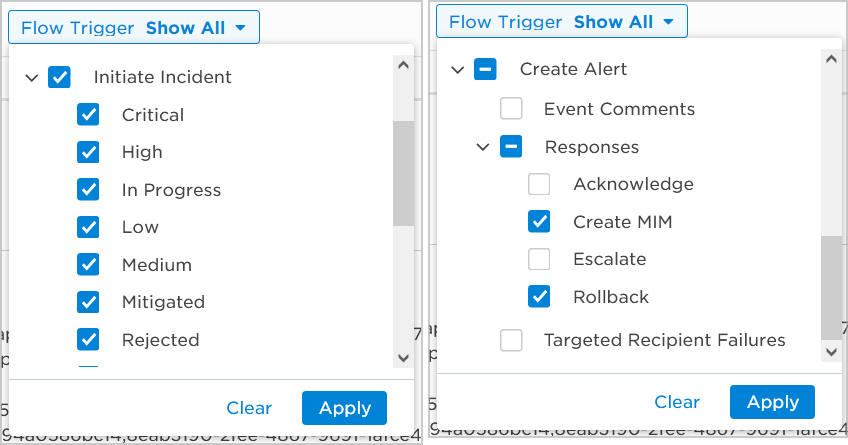
- More organized filters: The 'Flow Trigger' filter now groups Initiate Incident and Create Alert activity triggers so you can find them more quickly and select or clear them all at the same time.
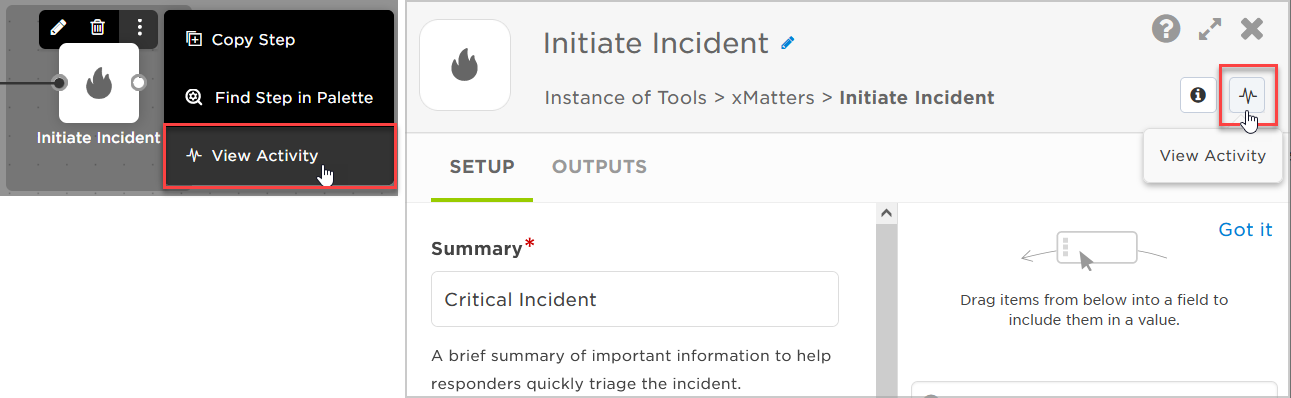
- Palette and step access: To filter activity to just flows that include a particular step, click 'View Activity' from the step's options menu in the palette or in the step's header.
Efficiently connect steps in your flow
Flow Designer is all about automating manual tasks, right? Well, you no longer need to manually draw the connections between your steps! Instead, simply bring a step close to the step you want to connect it to and when you see the blue plus ('+') symbol, release the step and it will automatically connect.
The best part? It even works for dropping a step in between two connected steps — check it out in the animated GIF below:
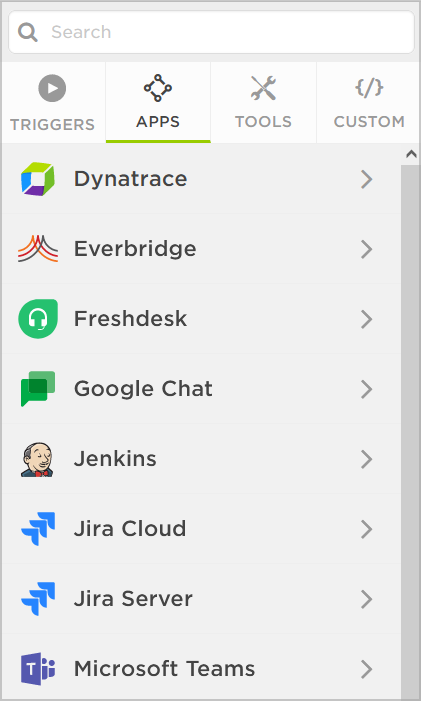
Find app steps alphabetically
A small, yet helpful improvement: we've organized steps on the Apps tab of the palette alphabetically by product name so they're faster to find.
xMatters REST API enhancements
We continually enhance our xMatters REST API calls to replace older REST methods and add more endpoints to increase programmatic interaction. These calls not only support customer integration needs, they're also the foundation for data access by our mobile clients, the web user interface, and other key xMatters services.
New endpoints
Add attachments to events (alerts) and scenarios
POST /attachments – Upload a file to xMatters to use as an attachment with existing events (alerts) and scenarios.
Create or modify response options for a form
POST /forms/{formId}/response-options – Create the responses available to users when they receive a notification. You can also use this endpoint to modify the properties of an existing response option.
Schedule messages to send in the future
- POST /scheduled-messages – Create or modify scheduled messages to be sent at a future date and time.
- GET /scheduled-messages – Returns a list of the scheduled messages in your system.
- GET /scheduled-messages/{scheduledMessageId} – Returns a single scheduled message, identified by its unique identifier.
- DELETE /scheduled-messages/{scheduledMessageId} – Deletes a scheduled message, identified by its unique identifier.
Get user license quotas
GET /people/license-quota – Returns the type (fullUsers or stakeholderUsers) and count (total, active, and unused) of user licenses for your company.
Group license quotas
GET /groups/license-quota – Returns the number of groups currently created for your company and the number of total groups allowed by your plan type.
Updated endpoints
View and download specific attachments
- GET /events/{eventId}/attachments/{attachmentId} – Returns a single attachment for a specific event so you can view or download it.
- GET /scenarios/{scenarioId}/attachments/{attachmentId} – Returns a single attachment for a specific scenario so you can view or download it.
Specify a user's license type
POST /people – Specify if a user has a FULL_USER or STAKEHOLDER license type when you create or update them.
Get default recipient info
GET /forms/{formId}/sections – This endpoint now also returns information about the form's default recipients, including their unique identifier, recipient type, target name, and other properties depending on the recipient type.
Get event (alerts) by incident
GET /events – Use the incidentID query parameter to specify the unique identifier or UUID of an incident and the response returns all events (alerts) associated with the incident.
User experience
User experience is a central theme of every feature and enhancement we build here at xMatters. In this section, we'll review some of the other major UX improvements we've made this quarter for managing groups, user devices, and your company's location settings.
Sneak peek: Create and manage broadcast groups
Availability: Pole Position (Jun/Jul 2022)
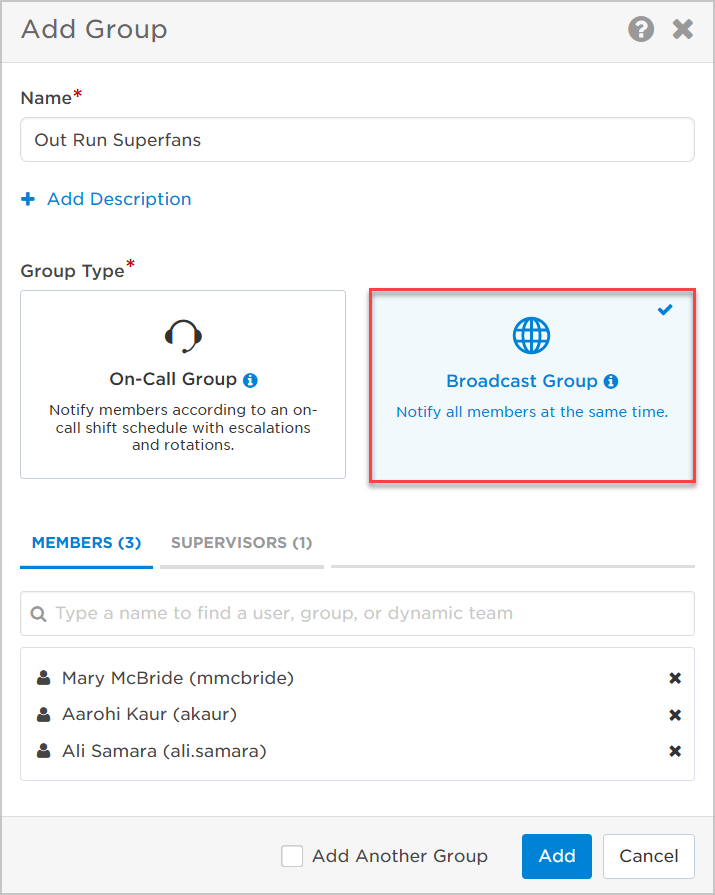
In some situations, it's useful to notify everyone in a group at once (for example, to take a poll or to send a mass notification during an emergency). While you can set up a '24x7' shift schedule to accomplish this, you don't require the many features and functionality of our powerful on-call shift scheduler. So, why complicate things?
The next time you add a group, you'll see we've updated the Add Group dialog box with the option to create an 'On-Call Group' or a 'Broadcast Group'. Broadcast groups are a new type of group specifically for creating a list of members you want to notify simultaneously.
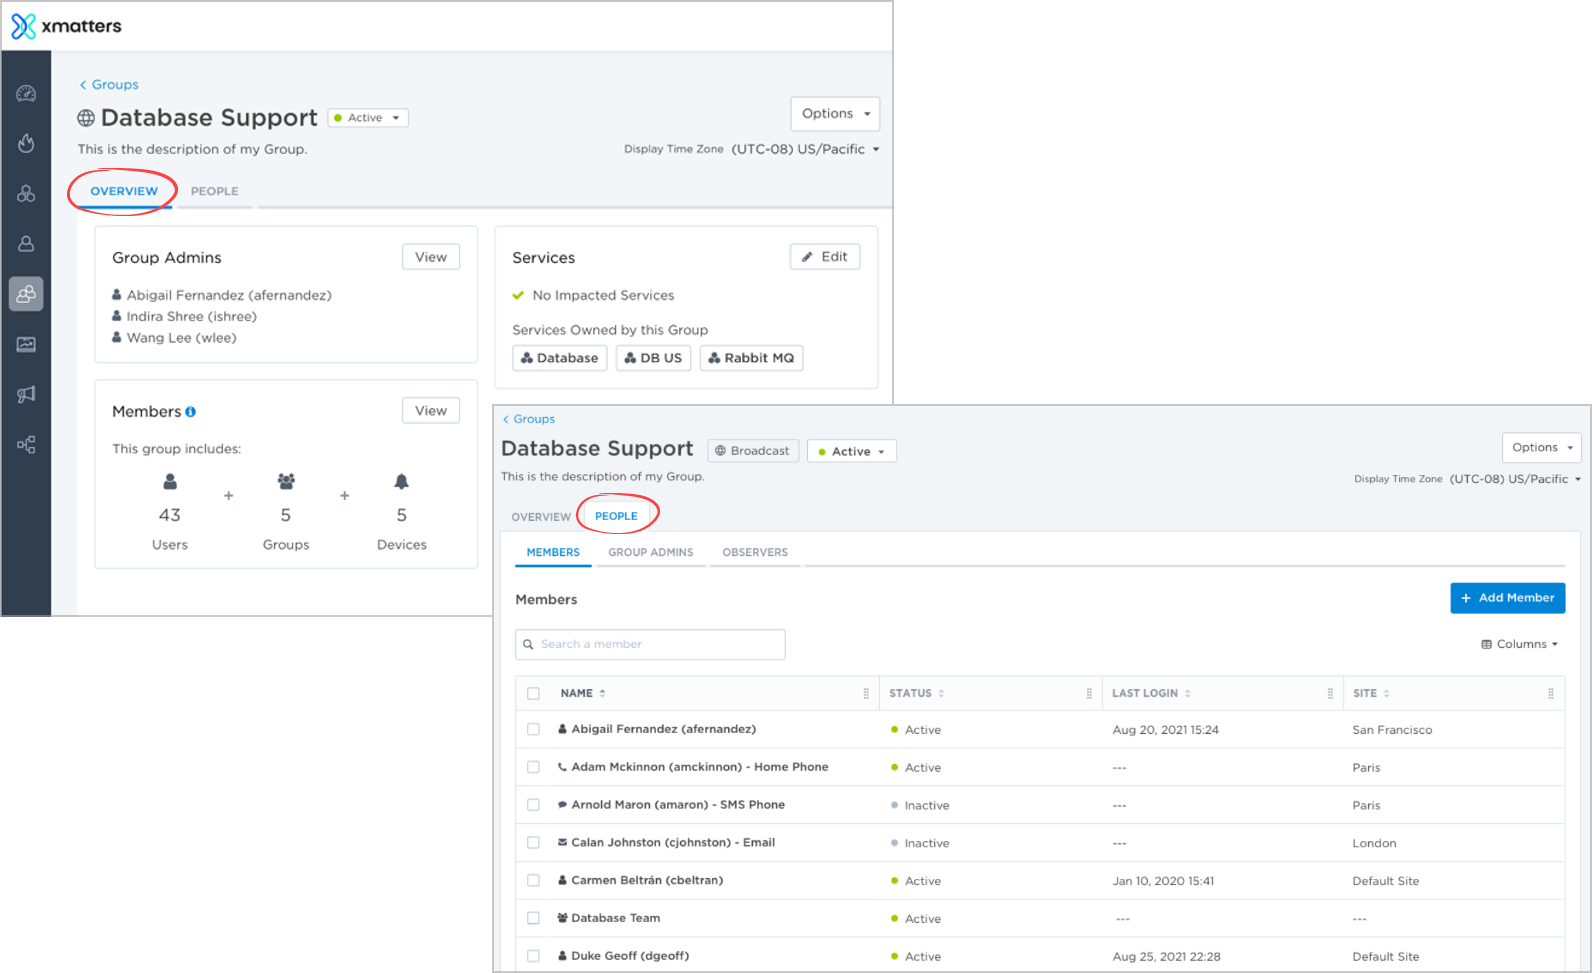
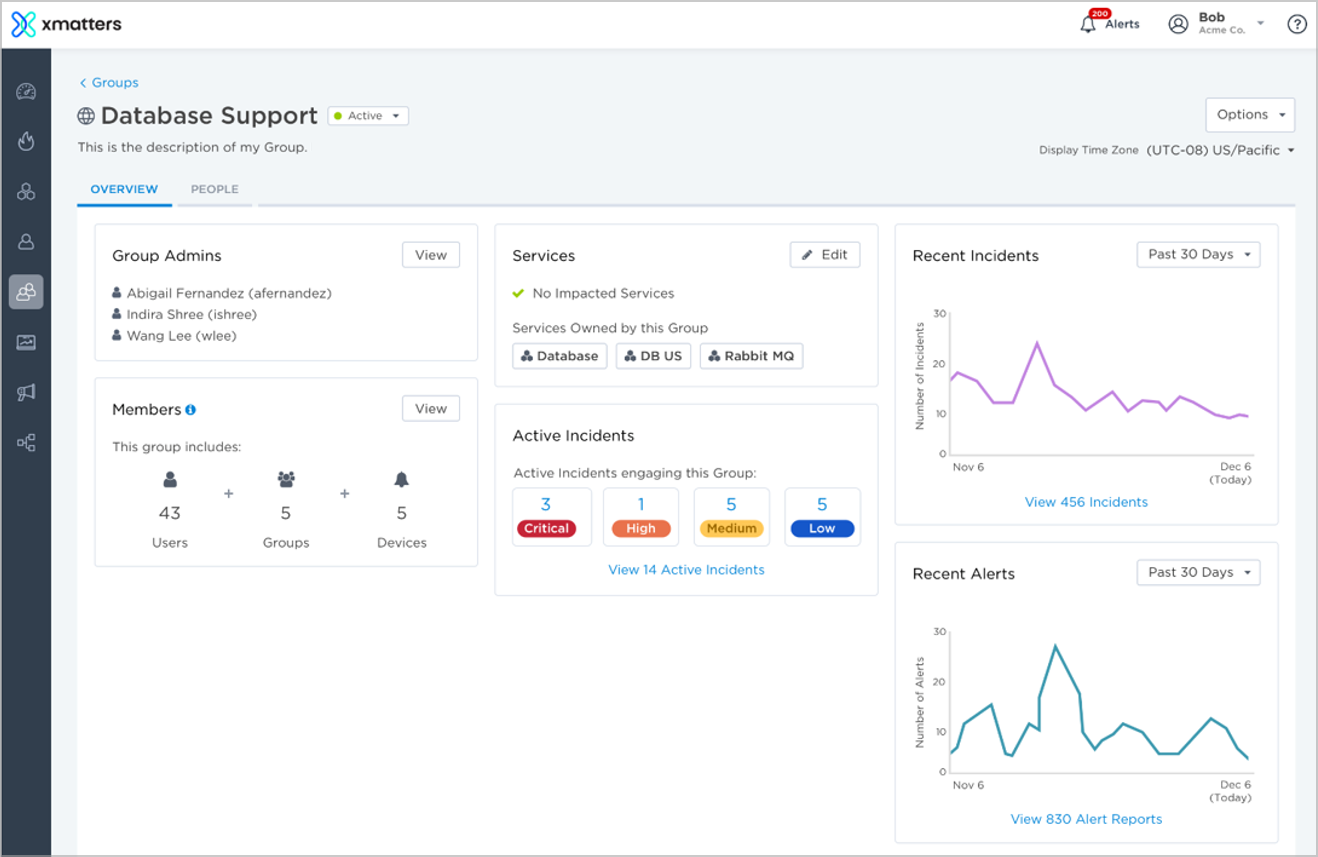
Broadcast groups have a simplified interface with just the settings and controls you need to create and manage this type of group. The Overview tab summarizes important information about the group, including its admins, members, and the services it owns. From here you can drill down to manage and view details of the people that make up the group, including its members, group admins, and group observers.
What's next?
Groups are predominately organized around services, and we'll be enhancing the group overview with information to support service intelligence, including which of the group's services are impacted by incidents, any active incidents the group is engaged in, and graphs for monitoring recent incidents and alerts involving the group.
User profile: Redesigned devices list
Over our last few releases, we've redesigned different components of the user profile in our web user interface to make it more convenient to find and manage user detail settings for yourself and users you supervise. We continue that work this release, with improvements to the interface for managing a user's devices in xMatters.
The new Devices screen makes it simpler to add and remove devices, set delays, and manage your device settings. We've surfaced the most frequently used settings so you can see at-a-glance how your devices are configured:
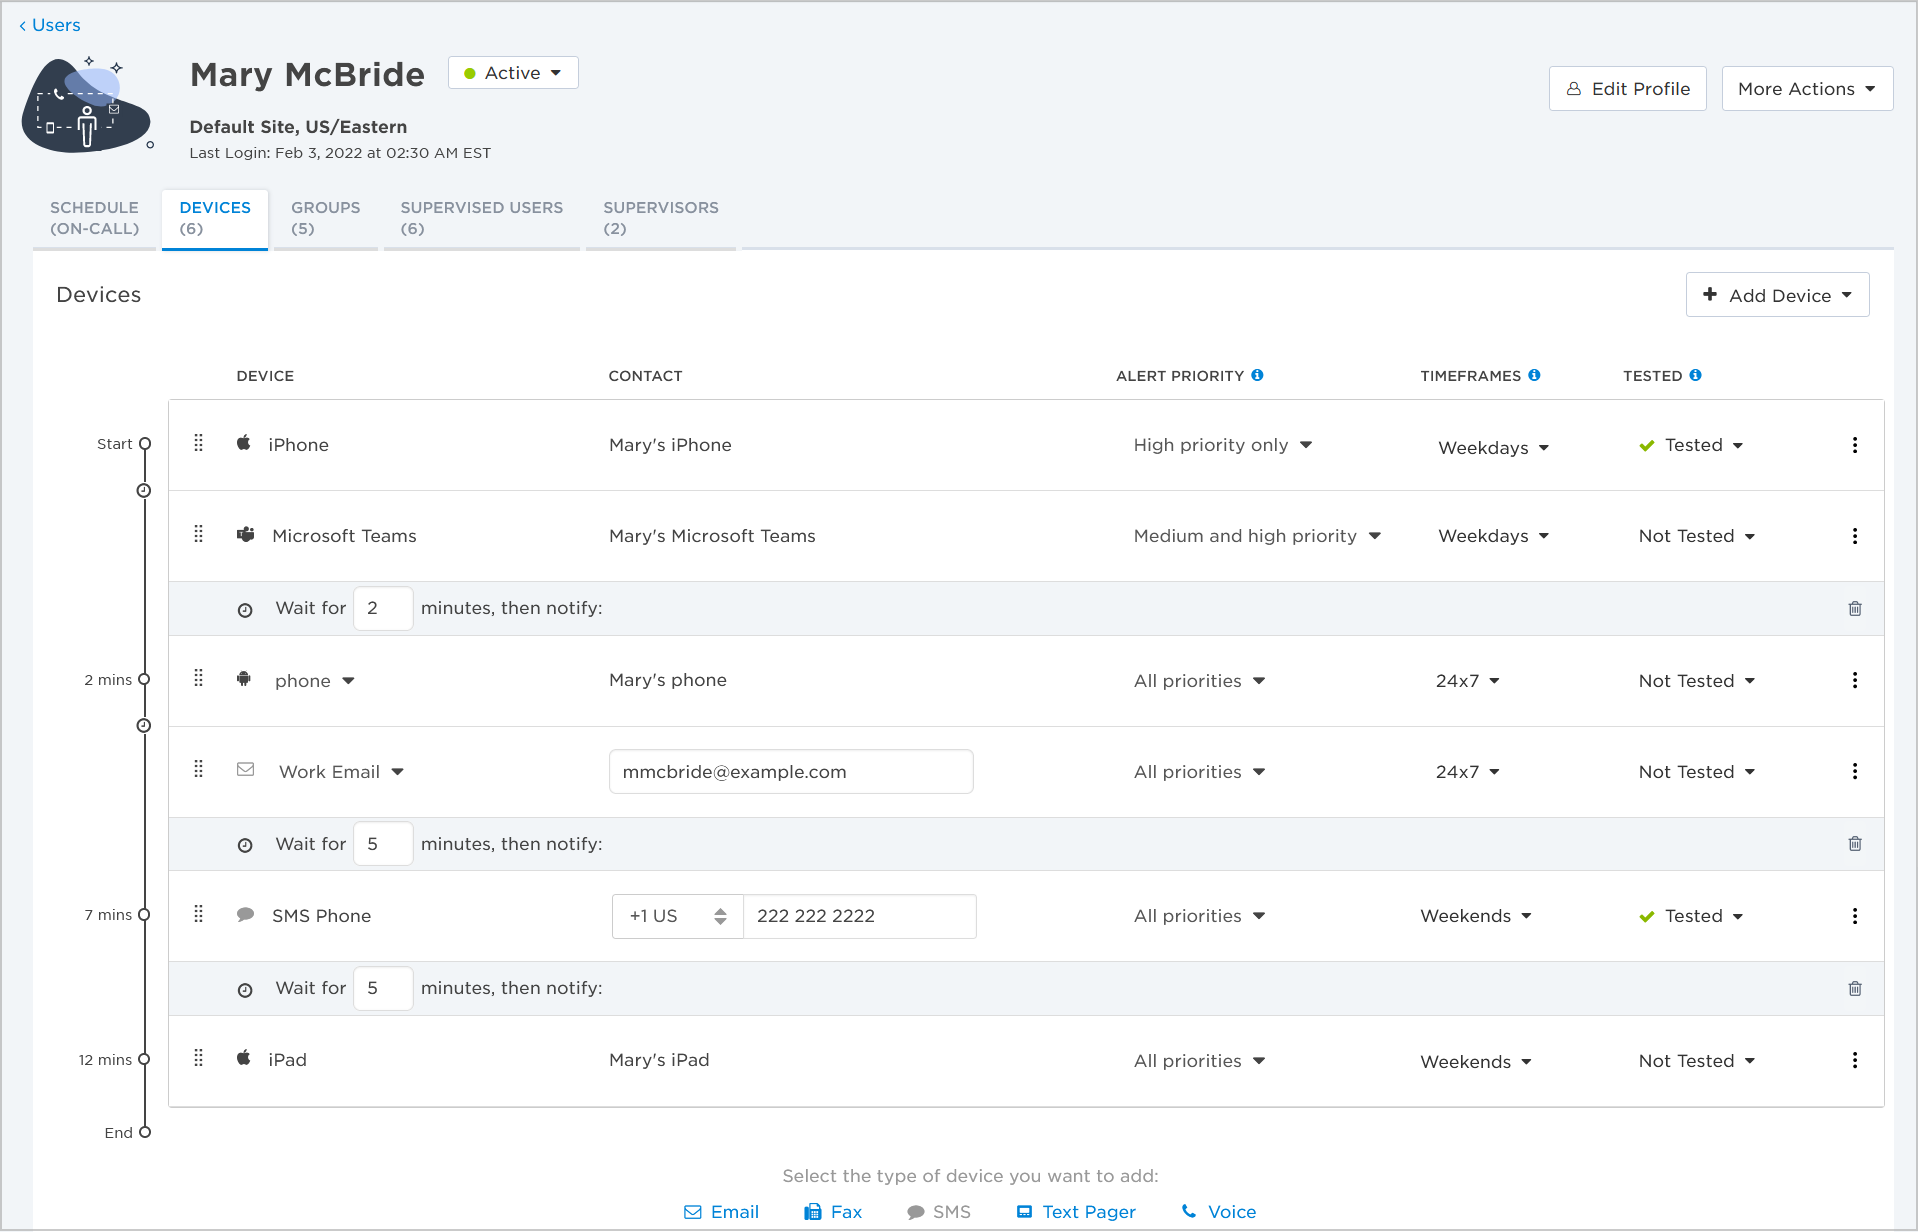
You may have noticed the absence of a 'Save Changes' button in the screenshot above — that's by design. Any changes you make to your devices are now saved automatically, so there's no risk you'll navigate away from this page and accidentally lose your updates.
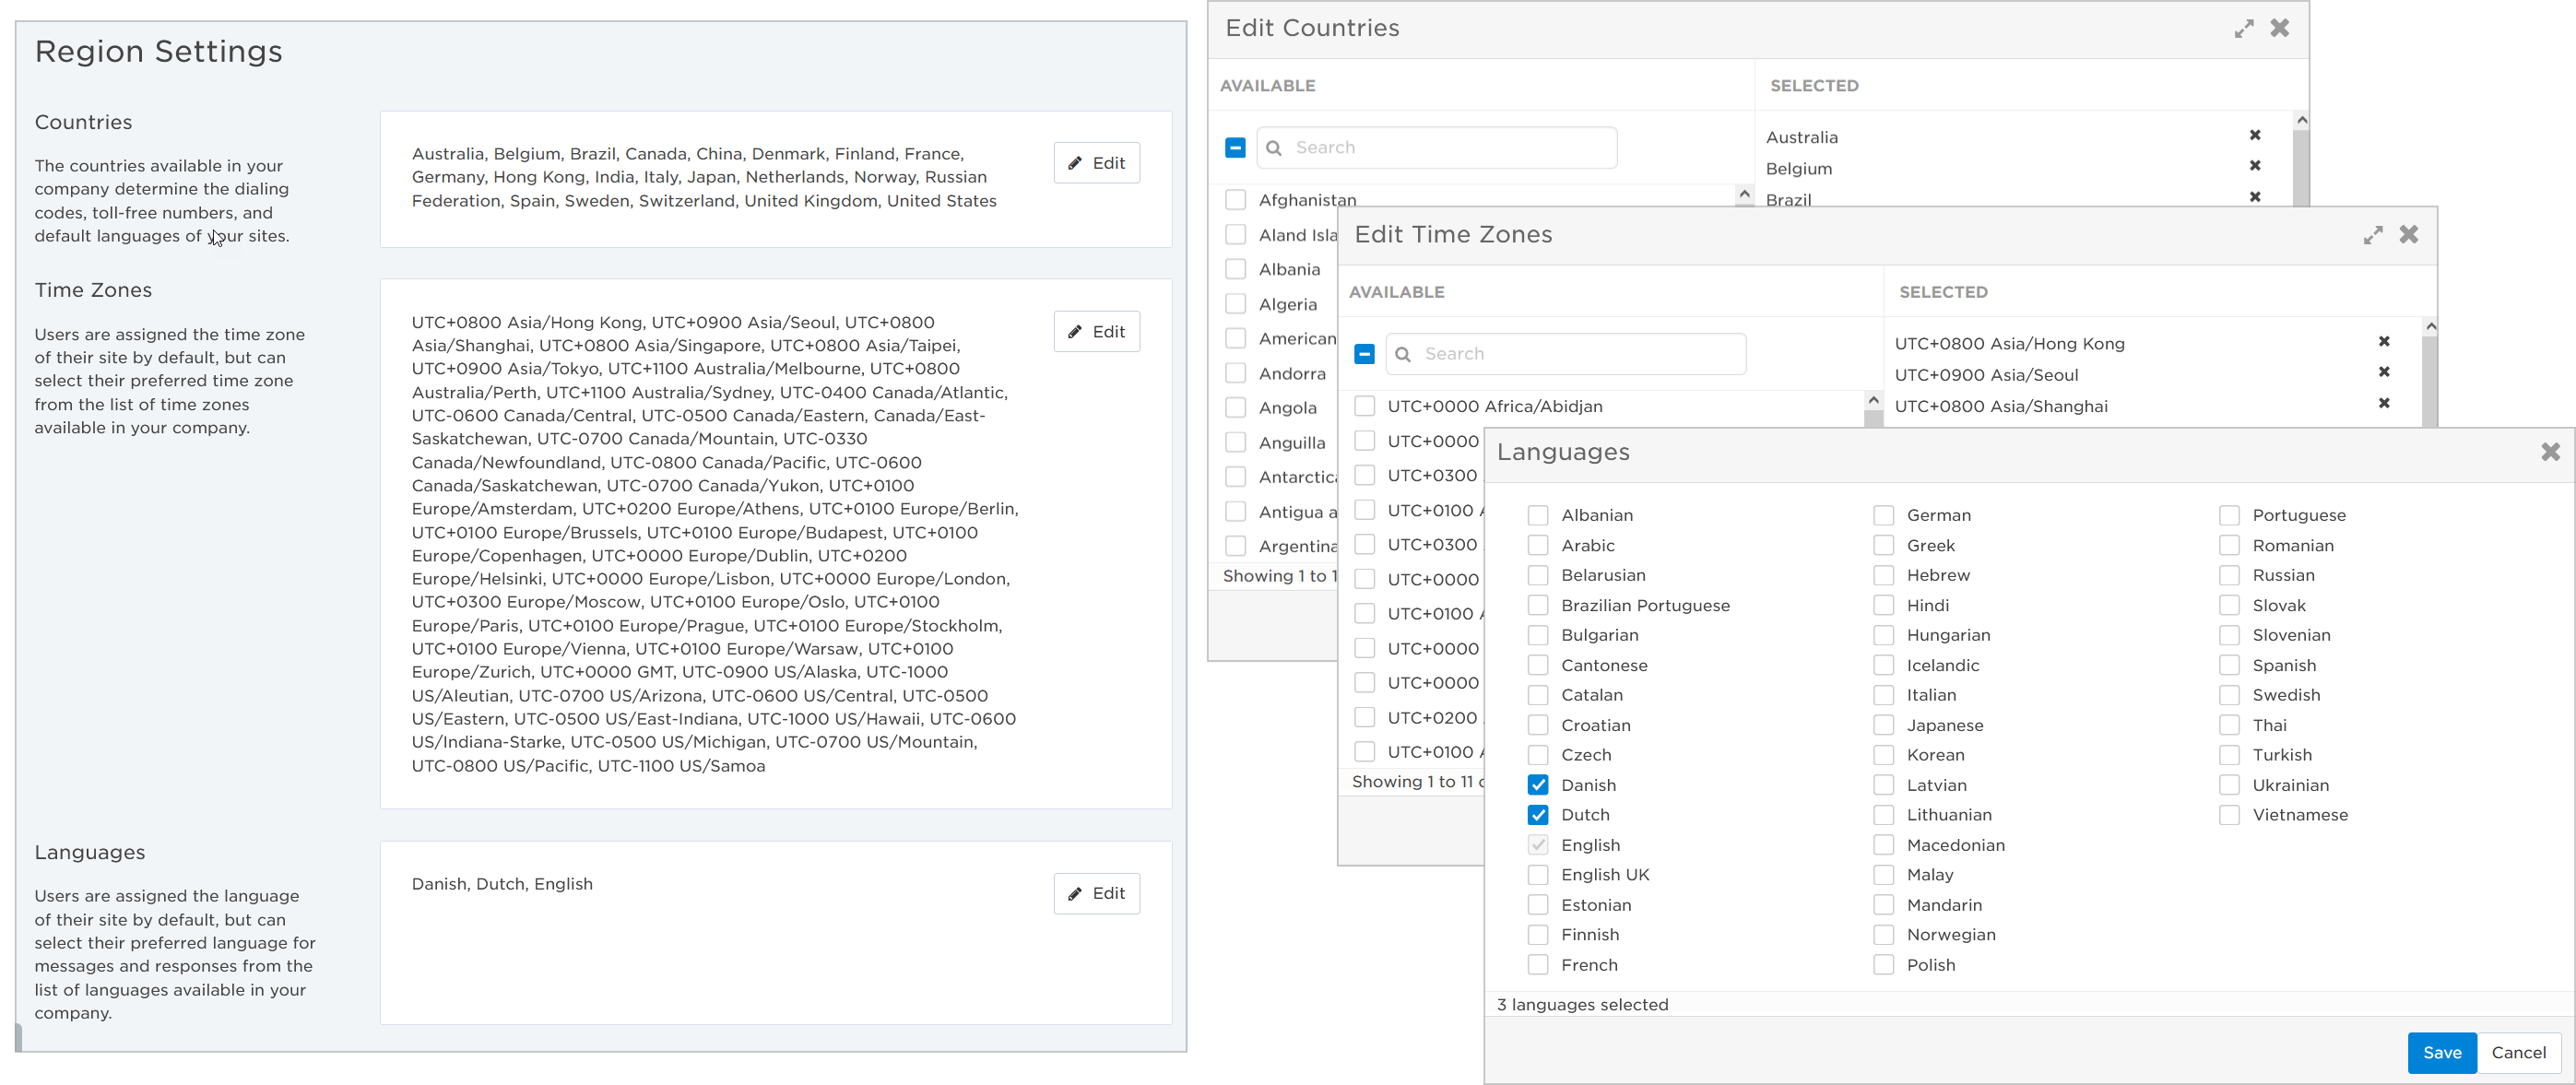
Redesigned company location settings
We've streamlined the admin screens for countries, time zones, and languages into a single Region Settings screen so it's more convenient for Company Supervisors to manage their company's location settings. Here's a look at the new design, which we think you'll agree makes it a breeze to review and manage these settings:
Reporting
In addition to building a new Incident MTTA & MTTR widget, with this release we've also reached the finish line for consolidating our alert reports into a single interface.
Unified alerts reporting
Over the past year, we've been consolidating the Recent Alerts and All Alerts reports into a single interface (the Alerts report) and enhancing the Alerts list, with a goal of streamlining how you manage alerts and troubleshoot signal-to-notification workflows in your system.
We've finished up that work this release, with the addition of the following functionality to the enhanced Alerts list:
- View and export the status of your alerts: Use the 'Status' column and filter to see and export active, suspended, or terminated alerts.
- Manage your alerts in bulk: Terminate, suspend, and resume multiple alerts at a time.
- Filter by notified recipients: View alerts that notified specific users, groups, dynamic teams, or devices.
- Filter by Request ID: Troubleshoot alerts related to specific signals by filtering on their request ID.
- View and export custom property values: Add columns for custom properties, filter on their values, and include this information in your exports.
And, we added a couple of new enhancements by popular demand:
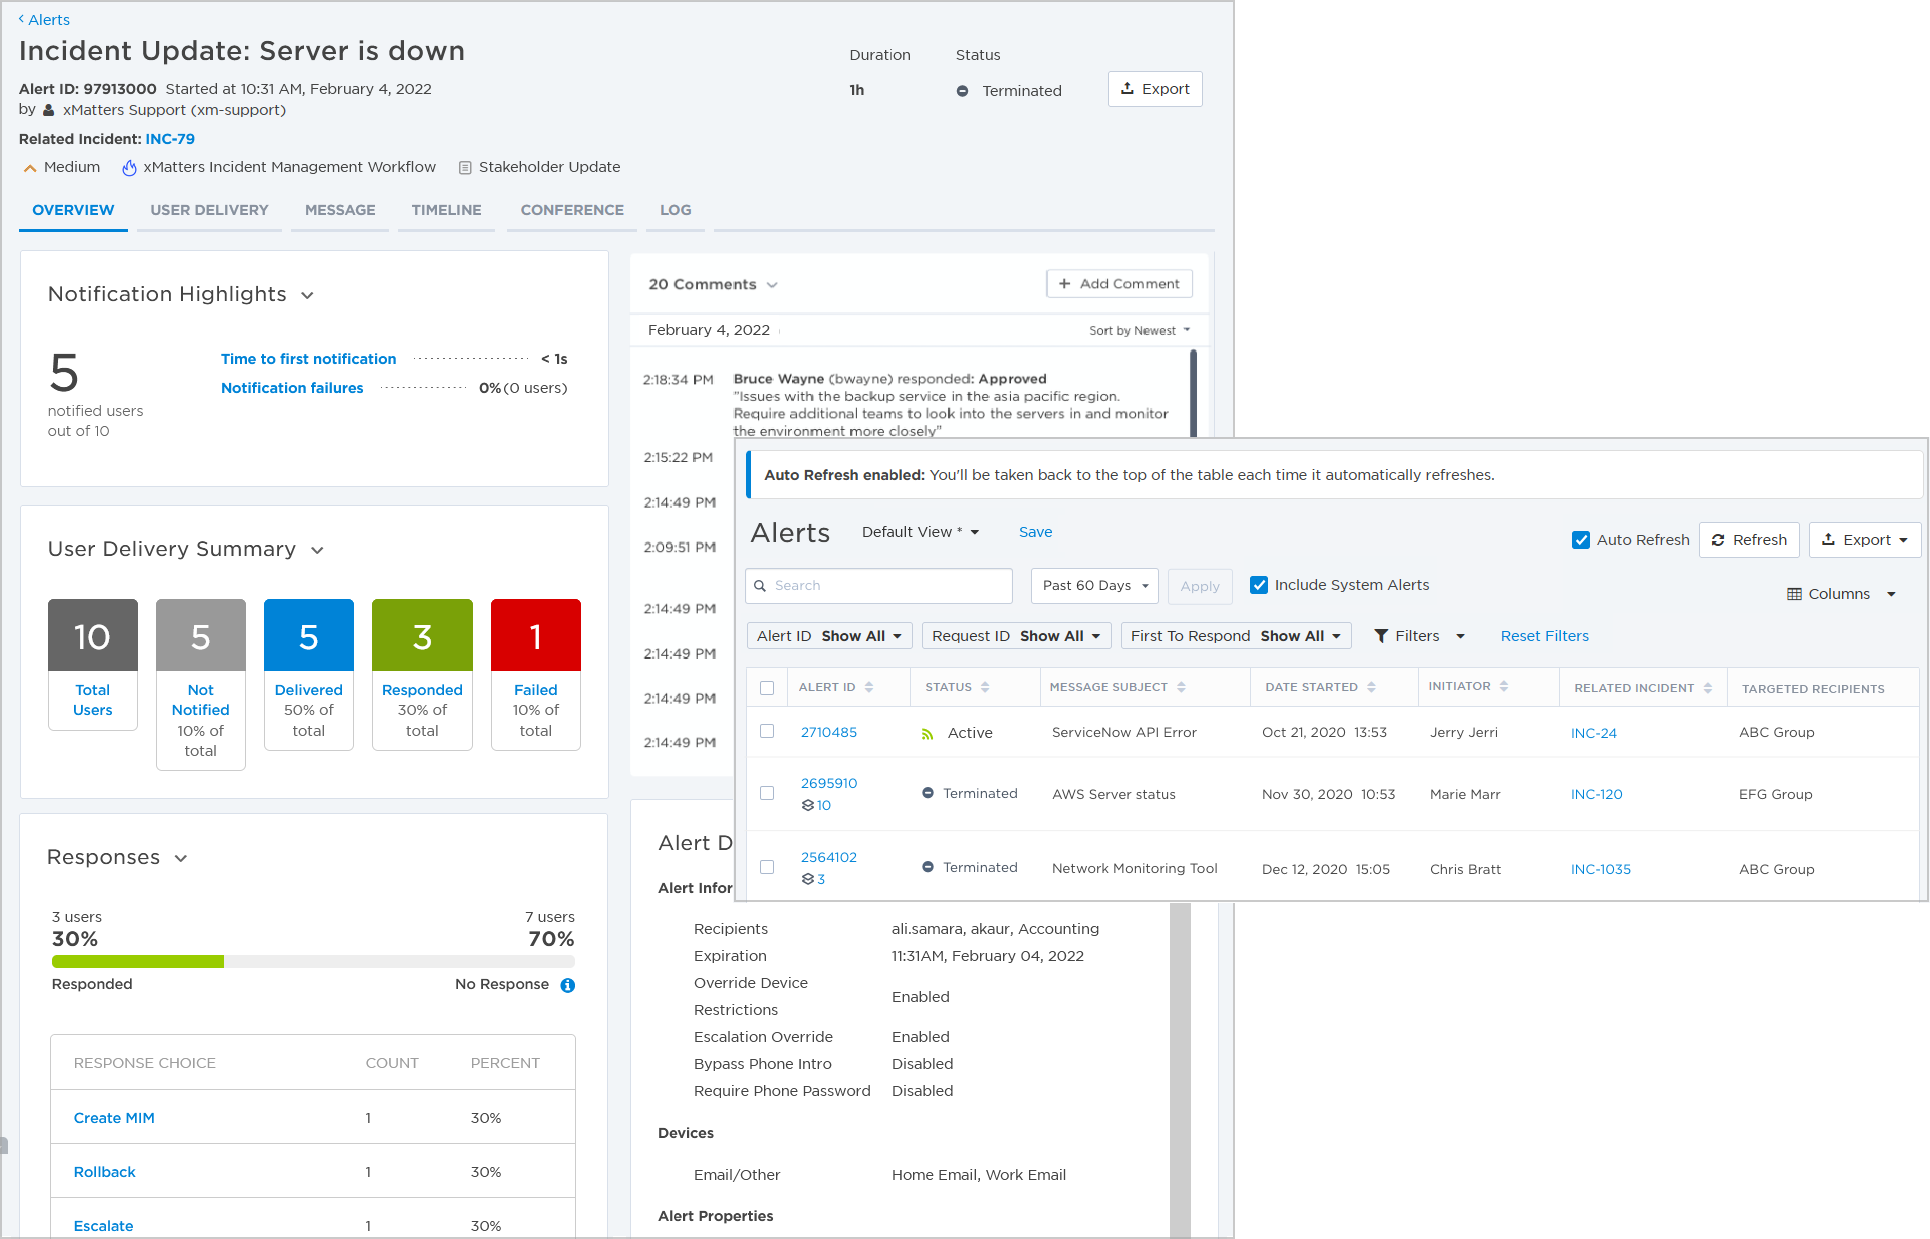
- See who responded first and how quickly: Use the 'First to Respond' column and filter to identify who first responded to each alert and the 'Time to First Response' column to see how long it took.
- Automatically stay up to date: Turn on Auto Refresh to monitor alerts as they happen without needing to manually refresh the report.
With these final changes in place, well be retiring the Recent Alerts report. You can now review and manage your alerts exclusively from the unified Alerts report.
Other product updates
It just wouldn't be an xMatters release without a couple of sneak peeks at other product updates we're working on.
Sneak peek: Include direct notifications in temporary absences
We're adding a new 'Include Direct Notification' option to the Add Temporary Absence configuration screen. You can use this setting to explicitly control whether your replacement should receive notifications that target you directly in your absence, or if the notifications should be discarded:

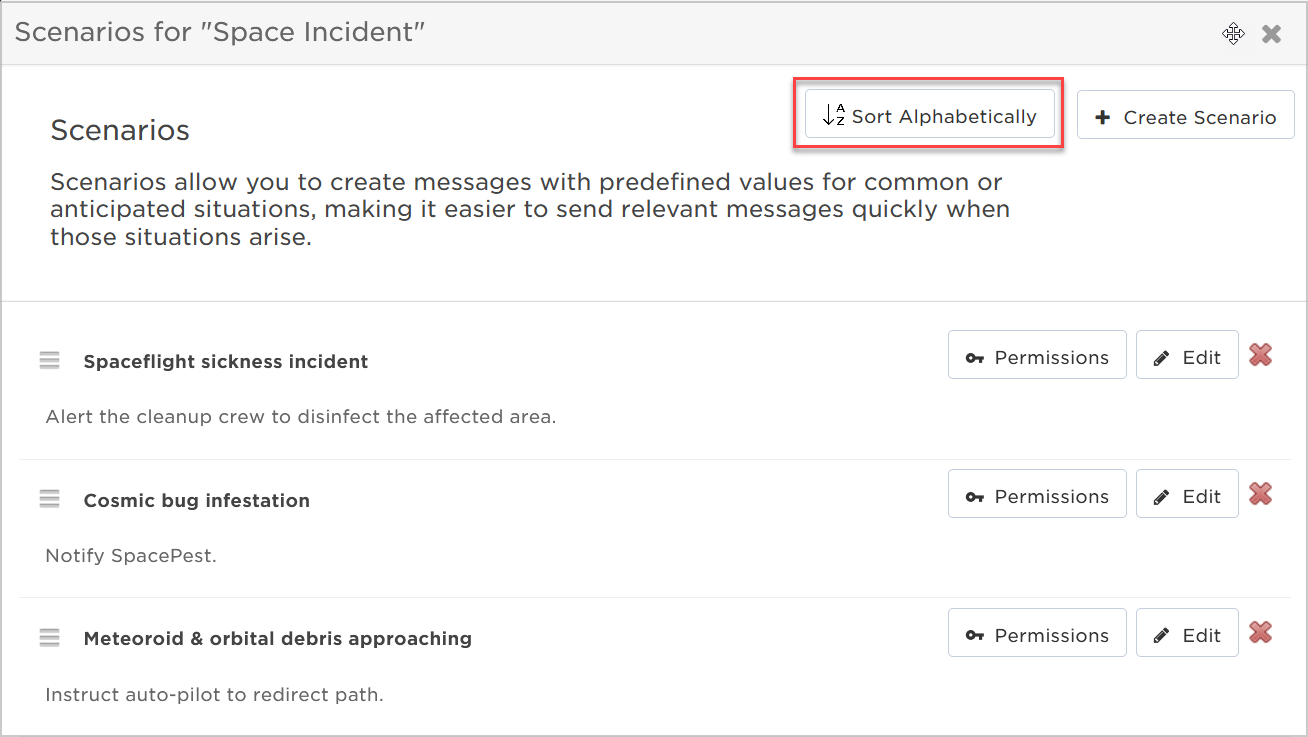
Sort scenarios alphabetically
Some of our customers have hundreds of scenarios for their messaging forms, which can make it difficult and time-consuming for message senders to find the one they need. To relieve this frustration and help message senders be able to locate the scenario they need more quickly, we'll be adding the ability to sort scenarios alphabetically:
Mobile app updates
We've already told you about the ability to view services and engage their owners and view incident stakeholders on our mobile apps. We've enhanced our mobile platform with a few additional features that we think you'll find useful.
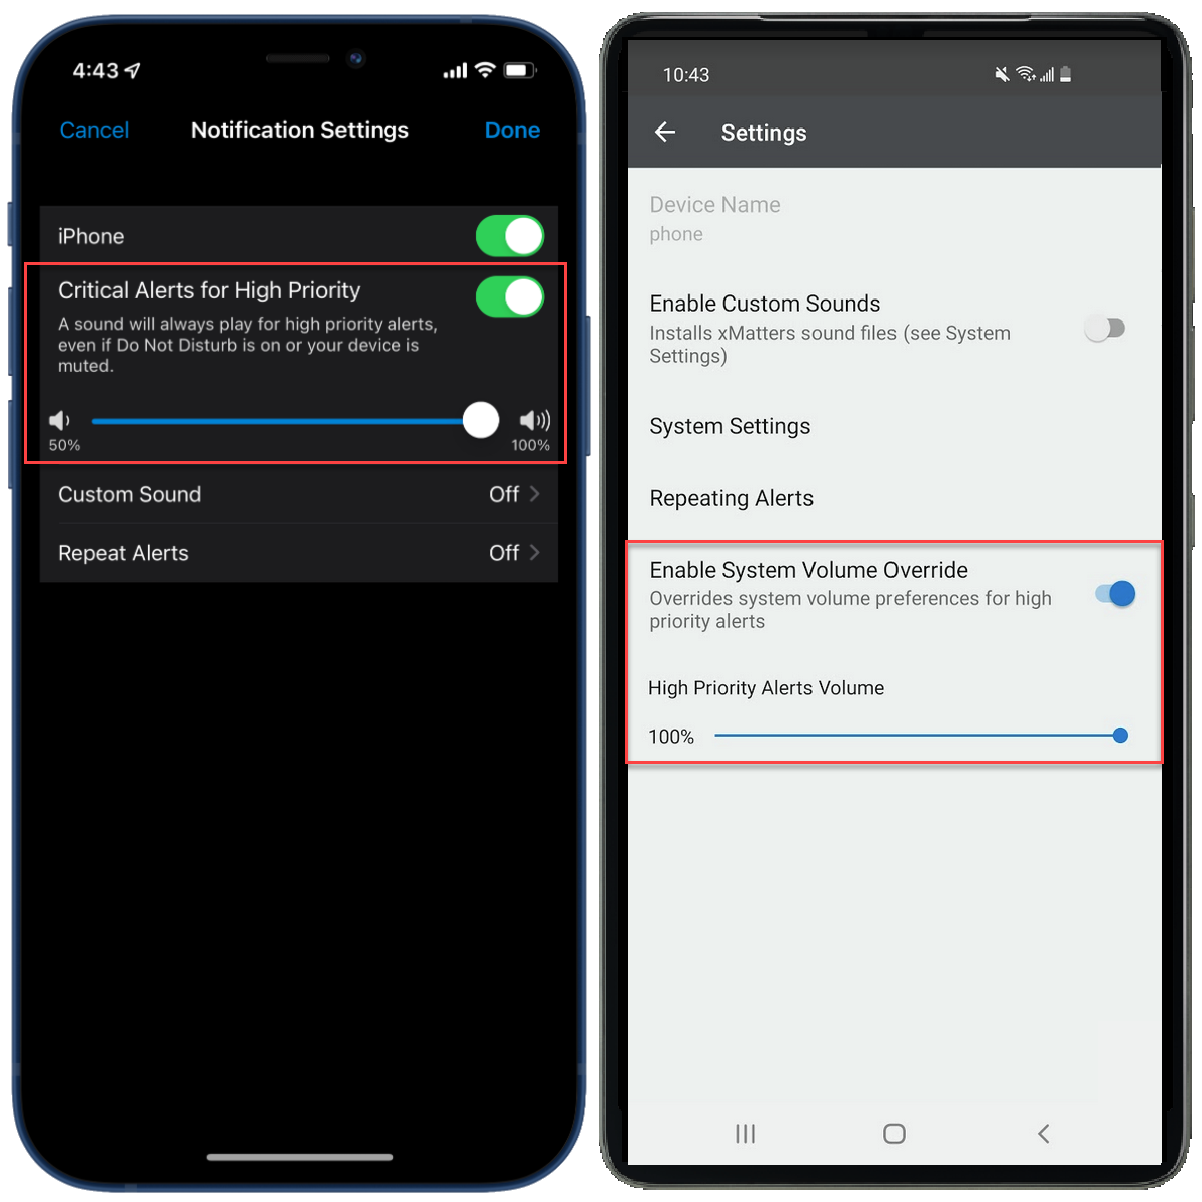
Never miss a high priority alert notification
Our iOS and Android apps now include settings to allow the xMatters app to play sounds for high priority alerts, even when a user has muted their phone (or enabled Do Not Disturb on iOS).
This feature is called 'Critical Alerts for High Priority' on iOS and 'Enable System Volume Override' on Android. You can enable this option and set the volume for high priority alerts from the app's notification settings:
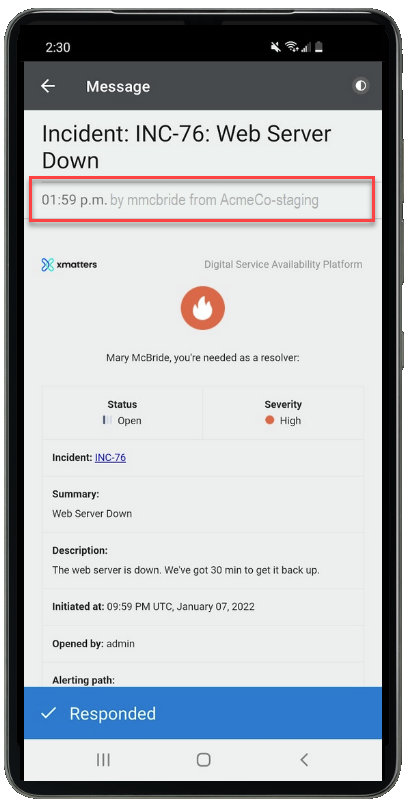
View the xMatters instance your message was sent from
If you're logged into more than one account on the app, messages will display the name of the xMatters instance they were sent from. This is helpful if, for example, you're testing things in your non-production environment and you don't want to confuse messages with those from your production account.
Clearly see which accounts you're logged into
Never mix up accounts with similar names again! The account details screen now clearly displays the company name, hostname, and username of each of the accounts you're logged into:

Early Access Program & feature delivery update
The goal of our current delivery model is to balance feature delivery with customer change management processes. This means providing visibility into upcoming changes for customers that want it, while allowing other customers to have a more standard non-production environment that matches production.
If you aren't familiar with the current model, we release features only visible to admins/developers at a faster pace than the quarterly release process. These features should not impact end users until a customer provisions them into their workflow. Customers can opt their non-production environments into the Early Access Program to see features and functionality enhancements that impact end users before they're released on a quarterly basis. All customer non-production environments are updated two weeks prior to an official quarterly production release to allow for testing and training on new features.
We regularly reevaluate and improve our deployment processes to ensure they reflect industry best practices and customer feedback. For more information about our deployment process, see our On-Demand Deployment Process and Early Access article. We'll update that document whenever we make a change, and let you know about the change through other appropriate channels.
Learn more
These are the main features for this release but be aware that there are several other small changes and enhancements we're delivering to keep xMatters looking sharp. Detailed information and instructions for using these new features will be available in our online documentation.
We hope you enjoy this release!
Comments
1 commentArticle is closed for comments.
The Out Run release is now available in production environments.